Immigrants from Eastern Europe vs Dominican Disability Age Under 5
COMPARE
Immigrants from Eastern Europe
Dominican
Disability Age Under 5
Disability Age Under 5 Comparison
Immigrants from Eastern Europe
Dominicans
1.2%
DISABILITY AGE UNDER 5
87.3/ 100
METRIC RATING
132nd/ 347
METRIC RANK
1.1%
DISABILITY AGE UNDER 5
96.3/ 100
METRIC RATING
99th/ 347
METRIC RANK
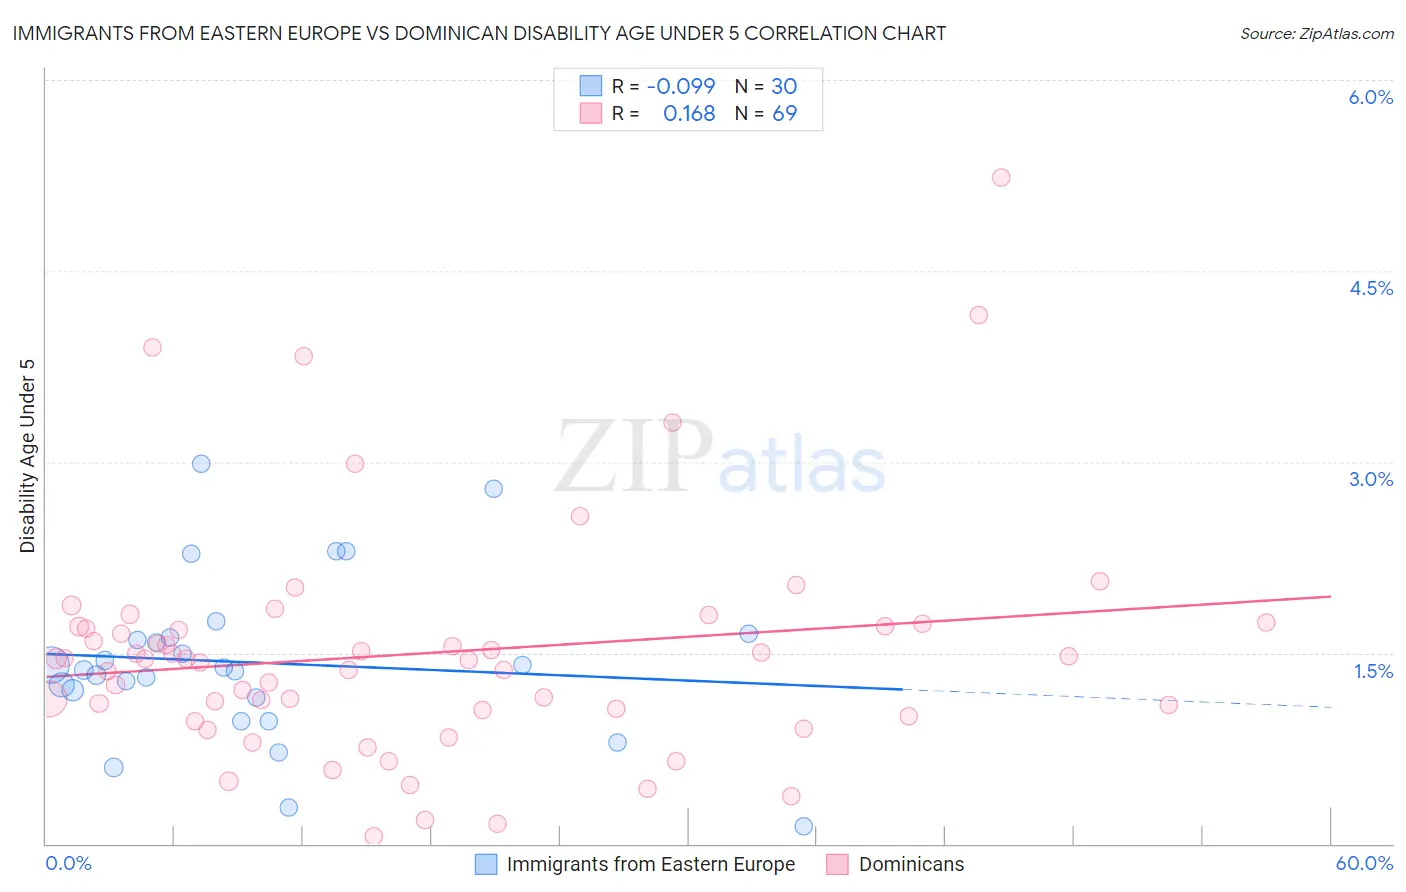
Immigrants from Eastern Europe vs Dominican Disability Age Under 5 Correlation Chart
The statistical analysis conducted on geographies consisting of 238,831,342 people shows a slight negative correlation between the proportion of Immigrants from Eastern Europe and percentage of population with a disability under the age of 5 in the United States with a correlation coefficient (R) of -0.099 and weighted average of 1.2%. Similarly, the statistical analysis conducted on geographies consisting of 197,745,211 people shows a poor positive correlation between the proportion of Dominicans and percentage of population with a disability under the age of 5 in the United States with a correlation coefficient (R) of 0.168 and weighted average of 1.1%, a difference of 3.3%.
Disability Age Under 5 Correlation Summary
| Measurement | Immigrants from Eastern Europe | Dominican |
| Minimum | 0.14% | 0.058% |
| Maximum | 3.0% | 5.2% |
| Range | 2.8% | 5.2% |
| Mean | 1.4% | 1.5% |
| Median | 1.4% | 1.5% |
| Interquartile 25% (IQ1) | 1.1% | 1.0% |
| Interquartile 75% (IQ3) | 1.6% | 1.7% |
| Interquartile Range (IQR) | 0.47% | 0.68% |
| Standard Deviation (Sample) | 0.64% | 0.92% |
| Standard Deviation (Population) | 0.63% | 0.91% |
Similar Demographics by Disability Age Under 5
Demographics Similar to Immigrants from Eastern Europe by Disability Age Under 5
In terms of disability age under 5, the demographic groups most similar to Immigrants from Eastern Europe are Immigrants from Serbia (1.2%, a difference of 0.070%), Korean (1.2%, a difference of 0.090%), Immigrants (1.2%, a difference of 0.16%), Immigrants from Spain (1.2%, a difference of 0.16%), and Immigrants from France (1.2%, a difference of 0.25%).
| Demographics | Rating | Rank | Disability Age Under 5 |
| Japanese | 90.3 /100 | #125 | Exceptional 1.2% |
| Central Americans | 89.7 /100 | #126 | Excellent 1.2% |
| Immigrants | Romania | 88.4 /100 | #127 | Excellent 1.2% |
| Immigrants | France | 88.4 /100 | #128 | Excellent 1.2% |
| Immigrants | Immigrants | 88.0 /100 | #129 | Excellent 1.2% |
| Koreans | 87.7 /100 | #130 | Excellent 1.2% |
| Immigrants | Serbia | 87.6 /100 | #131 | Excellent 1.2% |
| Immigrants | Eastern Europe | 87.3 /100 | #132 | Excellent 1.2% |
| Immigrants | Spain | 86.5 /100 | #133 | Excellent 1.2% |
| Argentineans | 85.7 /100 | #134 | Excellent 1.2% |
| Fijians | 84.7 /100 | #135 | Excellent 1.2% |
| Moroccans | 83.6 /100 | #136 | Excellent 1.2% |
| Immigrants | Eastern Africa | 83.1 /100 | #137 | Excellent 1.2% |
| Immigrants | Czechoslovakia | 82.8 /100 | #138 | Excellent 1.2% |
| New Zealanders | 81.4 /100 | #139 | Excellent 1.2% |
Demographics Similar to Dominicans by Disability Age Under 5
In terms of disability age under 5, the demographic groups most similar to Dominicans are Nicaraguan (1.1%, a difference of 0.030%), Immigrants from South Eastern Asia (1.1%, a difference of 0.13%), Immigrants from Iraq (1.1%, a difference of 0.14%), Immigrants from Uganda (1.1%, a difference of 0.14%), and Immigrants from Morocco (1.2%, a difference of 0.20%).
| Demographics | Rating | Rank | Disability Age Under 5 |
| Immigrants | Cuba | 97.0 /100 | #92 | Exceptional 1.1% |
| Spanish Americans | 96.9 /100 | #93 | Exceptional 1.1% |
| Sri Lankans | 96.8 /100 | #94 | Exceptional 1.1% |
| Immigrants | Moldova | 96.8 /100 | #95 | Exceptional 1.1% |
| Mongolians | 96.6 /100 | #96 | Exceptional 1.1% |
| Immigrants | Iraq | 96.5 /100 | #97 | Exceptional 1.1% |
| Immigrants | South Eastern Asia | 96.5 /100 | #98 | Exceptional 1.1% |
| Dominicans | 96.3 /100 | #99 | Exceptional 1.1% |
| Nicaraguans | 96.3 /100 | #100 | Exceptional 1.1% |
| Immigrants | Uganda | 96.1 /100 | #101 | Exceptional 1.1% |
| Immigrants | Morocco | 96.0 /100 | #102 | Exceptional 1.2% |
| Immigrants | Nicaragua | 96.0 /100 | #103 | Exceptional 1.2% |
| Indonesians | 95.9 /100 | #104 | Exceptional 1.2% |
| Immigrants | South Africa | 95.6 /100 | #105 | Exceptional 1.2% |
| Cambodians | 95.4 /100 | #106 | Exceptional 1.2% |