Brazilian vs Dominican Disability Age Under 5
COMPARE
Brazilian
Dominican
Disability Age Under 5
Disability Age Under 5 Comparison
Brazilians
Dominicans
1.5%
DISABILITY AGE UNDER 5
0.0/ 100
METRIC RATING
275th/ 347
METRIC RANK
1.1%
DISABILITY AGE UNDER 5
96.3/ 100
METRIC RATING
99th/ 347
METRIC RANK
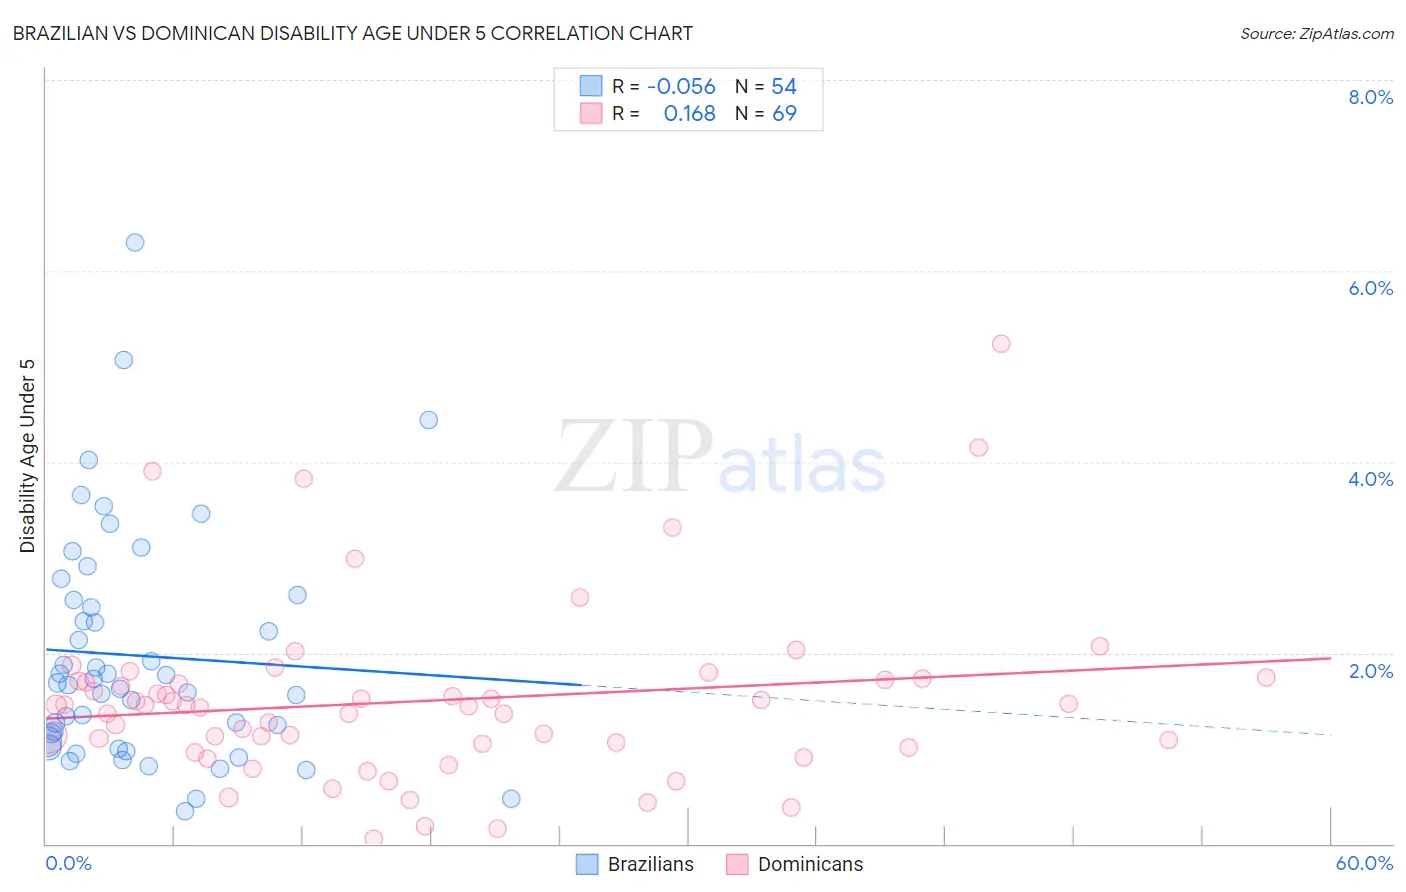
Brazilian vs Dominican Disability Age Under 5 Correlation Chart
The statistical analysis conducted on geographies consisting of 185,712,155 people shows a slight negative correlation between the proportion of Brazilians and percentage of population with a disability under the age of 5 in the United States with a correlation coefficient (R) of -0.056 and weighted average of 1.5%. Similarly, the statistical analysis conducted on geographies consisting of 197,745,211 people shows a poor positive correlation between the proportion of Dominicans and percentage of population with a disability under the age of 5 in the United States with a correlation coefficient (R) of 0.168 and weighted average of 1.1%, a difference of 26.8%.
Disability Age Under 5 Correlation Summary
| Measurement | Brazilian | Dominican |
| Minimum | 0.34% | 0.058% |
| Maximum | 6.3% | 5.2% |
| Range | 6.0% | 5.2% |
| Mean | 2.0% | 1.5% |
| Median | 1.7% | 1.5% |
| Interquartile 25% (IQ1) | 1.1% | 1.0% |
| Interquartile 75% (IQ3) | 2.5% | 1.7% |
| Interquartile Range (IQR) | 1.5% | 0.68% |
| Standard Deviation (Sample) | 1.2% | 0.92% |
| Standard Deviation (Population) | 1.2% | 0.91% |
Similar Demographics by Disability Age Under 5
Demographics Similar to Brazilians by Disability Age Under 5
In terms of disability age under 5, the demographic groups most similar to Brazilians are Iroquois (1.5%, a difference of 0.11%), Alaskan Athabascan (1.5%, a difference of 0.38%), Greek (1.5%, a difference of 0.57%), Black/African American (1.4%, a difference of 0.67%), and Immigrants from Canada (1.4%, a difference of 0.83%).
| Demographics | Rating | Rank | Disability Age Under 5 |
| Belgians | 0.1 /100 | #268 | Tragic 1.4% |
| Austrians | 0.1 /100 | #269 | Tragic 1.4% |
| Immigrants | North America | 0.1 /100 | #270 | Tragic 1.4% |
| Immigrants | Canada | 0.1 /100 | #271 | Tragic 1.4% |
| Blacks/African Americans | 0.1 /100 | #272 | Tragic 1.4% |
| Alaskan Athabascans | 0.1 /100 | #273 | Tragic 1.5% |
| Iroquois | 0.0 /100 | #274 | Tragic 1.5% |
| Brazilians | 0.0 /100 | #275 | Tragic 1.5% |
| Greeks | 0.0 /100 | #276 | Tragic 1.5% |
| Canadians | 0.0 /100 | #277 | Tragic 1.5% |
| Kiowa | 0.0 /100 | #278 | Tragic 1.5% |
| Danes | 0.0 /100 | #279 | Tragic 1.5% |
| British | 0.0 /100 | #280 | Tragic 1.5% |
| Czechoslovakians | 0.0 /100 | #281 | Tragic 1.5% |
| Cheyenne | 0.0 /100 | #282 | Tragic 1.5% |
Demographics Similar to Dominicans by Disability Age Under 5
In terms of disability age under 5, the demographic groups most similar to Dominicans are Nicaraguan (1.1%, a difference of 0.030%), Immigrants from South Eastern Asia (1.1%, a difference of 0.13%), Immigrants from Iraq (1.1%, a difference of 0.14%), Immigrants from Uganda (1.1%, a difference of 0.14%), and Immigrants from Morocco (1.2%, a difference of 0.20%).
| Demographics | Rating | Rank | Disability Age Under 5 |
| Immigrants | Cuba | 97.0 /100 | #92 | Exceptional 1.1% |
| Spanish Americans | 96.9 /100 | #93 | Exceptional 1.1% |
| Sri Lankans | 96.8 /100 | #94 | Exceptional 1.1% |
| Immigrants | Moldova | 96.8 /100 | #95 | Exceptional 1.1% |
| Mongolians | 96.6 /100 | #96 | Exceptional 1.1% |
| Immigrants | Iraq | 96.5 /100 | #97 | Exceptional 1.1% |
| Immigrants | South Eastern Asia | 96.5 /100 | #98 | Exceptional 1.1% |
| Dominicans | 96.3 /100 | #99 | Exceptional 1.1% |
| Nicaraguans | 96.3 /100 | #100 | Exceptional 1.1% |
| Immigrants | Uganda | 96.1 /100 | #101 | Exceptional 1.1% |
| Immigrants | Morocco | 96.0 /100 | #102 | Exceptional 1.2% |
| Immigrants | Nicaragua | 96.0 /100 | #103 | Exceptional 1.2% |
| Indonesians | 95.9 /100 | #104 | Exceptional 1.2% |
| Immigrants | South Africa | 95.6 /100 | #105 | Exceptional 1.2% |
| Cambodians | 95.4 /100 | #106 | Exceptional 1.2% |