Immigrants from Cameroon vs Dominican Disability Age Under 5
COMPARE
Immigrants from Cameroon
Dominican
Disability Age Under 5
Disability Age Under 5 Comparison
Immigrants from Cameroon
Dominicans
1.4%
DISABILITY AGE UNDER 5
1.7/ 100
METRIC RATING
243rd/ 347
METRIC RANK
1.1%
DISABILITY AGE UNDER 5
96.3/ 100
METRIC RATING
99th/ 347
METRIC RANK
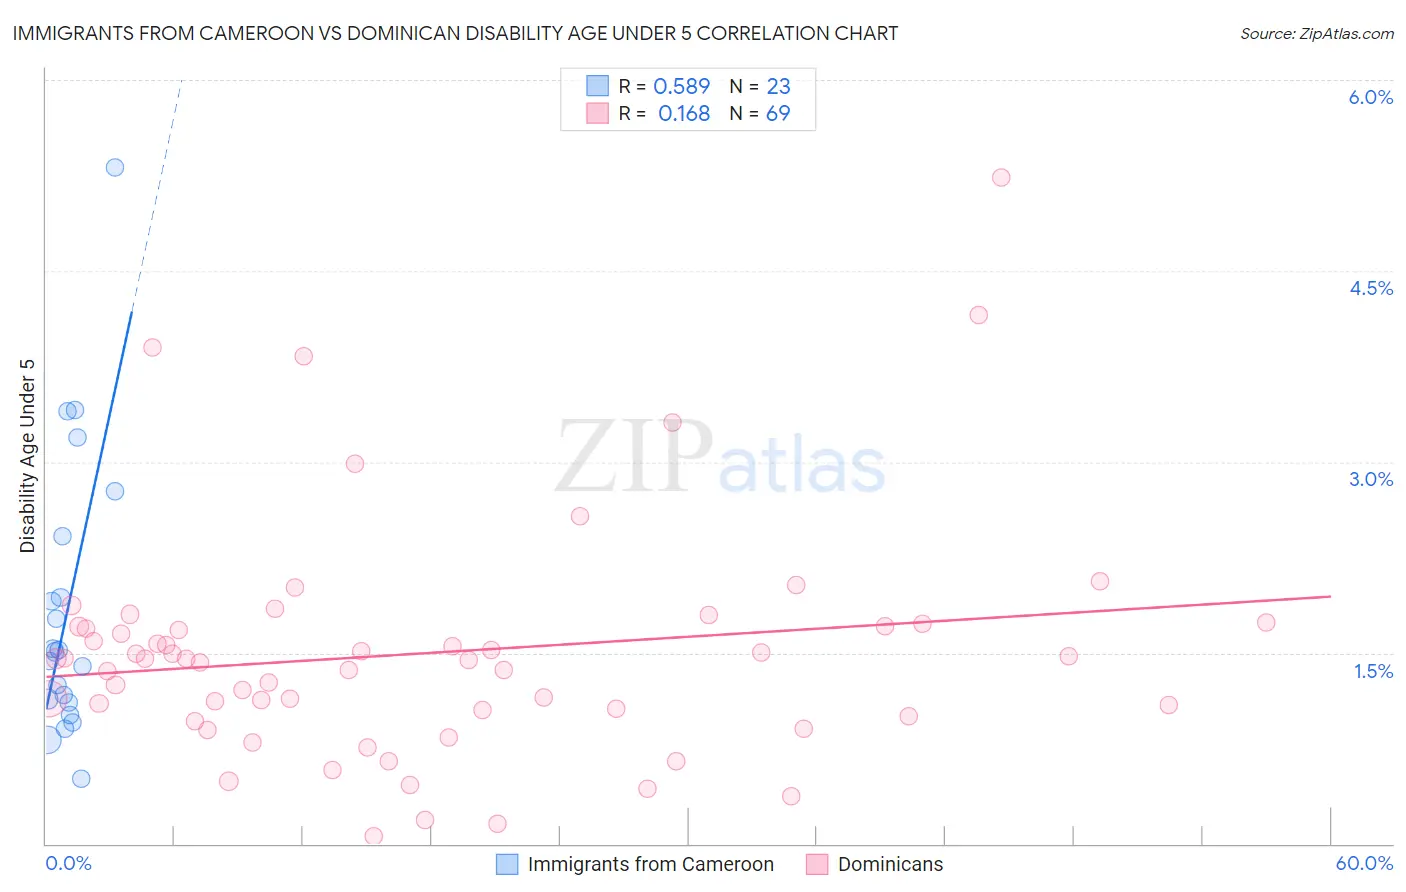
Immigrants from Cameroon vs Dominican Disability Age Under 5 Correlation Chart
The statistical analysis conducted on geographies consisting of 95,639,339 people shows a substantial positive correlation between the proportion of Immigrants from Cameroon and percentage of population with a disability under the age of 5 in the United States with a correlation coefficient (R) of 0.589 and weighted average of 1.4%. Similarly, the statistical analysis conducted on geographies consisting of 197,745,211 people shows a poor positive correlation between the proportion of Dominicans and percentage of population with a disability under the age of 5 in the United States with a correlation coefficient (R) of 0.168 and weighted average of 1.1%, a difference of 17.8%.
Disability Age Under 5 Correlation Summary
| Measurement | Immigrants from Cameroon | Dominican |
| Minimum | 0.51% | 0.058% |
| Maximum | 5.3% | 5.2% |
| Range | 4.8% | 5.2% |
| Mean | 1.8% | 1.5% |
| Median | 1.5% | 1.5% |
| Interquartile 25% (IQ1) | 1.1% | 1.0% |
| Interquartile 75% (IQ3) | 2.4% | 1.7% |
| Interquartile Range (IQR) | 1.3% | 0.68% |
| Standard Deviation (Sample) | 1.1% | 0.92% |
| Standard Deviation (Population) | 1.1% | 0.91% |
Similar Demographics by Disability Age Under 5
Demographics Similar to Immigrants from Cameroon by Disability Age Under 5
In terms of disability age under 5, the demographic groups most similar to Immigrants from Cameroon are Lumbee (1.3%, a difference of 0.38%), Spaniard (1.4%, a difference of 0.43%), Maltese (1.3%, a difference of 0.46%), Native Hawaiian (1.3%, a difference of 0.53%), and Immigrants from Austria (1.3%, a difference of 0.56%).
| Demographics | Rating | Rank | Disability Age Under 5 |
| South American Indians | 3.3 /100 | #236 | Tragic 1.3% |
| Basques | 3.0 /100 | #237 | Tragic 1.3% |
| Spanish American Indians | 2.4 /100 | #238 | Tragic 1.3% |
| Immigrants | Austria | 2.3 /100 | #239 | Tragic 1.3% |
| Native Hawaiians | 2.2 /100 | #240 | Tragic 1.3% |
| Maltese | 2.2 /100 | #241 | Tragic 1.3% |
| Lumbee | 2.1 /100 | #242 | Tragic 1.3% |
| Immigrants | Cameroon | 1.7 /100 | #243 | Tragic 1.4% |
| Spaniards | 1.4 /100 | #244 | Tragic 1.4% |
| Potawatomi | 1.1 /100 | #245 | Tragic 1.4% |
| Russians | 1.0 /100 | #246 | Tragic 1.4% |
| Immigrants | England | 1.0 /100 | #247 | Tragic 1.4% |
| Eastern Europeans | 1.0 /100 | #248 | Tragic 1.4% |
| Bermudans | 1.0 /100 | #249 | Tragic 1.4% |
| Africans | 1.0 /100 | #250 | Tragic 1.4% |
Demographics Similar to Dominicans by Disability Age Under 5
In terms of disability age under 5, the demographic groups most similar to Dominicans are Nicaraguan (1.1%, a difference of 0.030%), Immigrants from South Eastern Asia (1.1%, a difference of 0.13%), Immigrants from Iraq (1.1%, a difference of 0.14%), Immigrants from Uganda (1.1%, a difference of 0.14%), and Immigrants from Morocco (1.2%, a difference of 0.20%).
| Demographics | Rating | Rank | Disability Age Under 5 |
| Immigrants | Cuba | 97.0 /100 | #92 | Exceptional 1.1% |
| Spanish Americans | 96.9 /100 | #93 | Exceptional 1.1% |
| Sri Lankans | 96.8 /100 | #94 | Exceptional 1.1% |
| Immigrants | Moldova | 96.8 /100 | #95 | Exceptional 1.1% |
| Mongolians | 96.6 /100 | #96 | Exceptional 1.1% |
| Immigrants | Iraq | 96.5 /100 | #97 | Exceptional 1.1% |
| Immigrants | South Eastern Asia | 96.5 /100 | #98 | Exceptional 1.1% |
| Dominicans | 96.3 /100 | #99 | Exceptional 1.1% |
| Nicaraguans | 96.3 /100 | #100 | Exceptional 1.1% |
| Immigrants | Uganda | 96.1 /100 | #101 | Exceptional 1.1% |
| Immigrants | Morocco | 96.0 /100 | #102 | Exceptional 1.2% |
| Immigrants | Nicaragua | 96.0 /100 | #103 | Exceptional 1.2% |
| Indonesians | 95.9 /100 | #104 | Exceptional 1.2% |
| Immigrants | South Africa | 95.6 /100 | #105 | Exceptional 1.2% |
| Cambodians | 95.4 /100 | #106 | Exceptional 1.2% |