Immigrants from Eritrea vs Dominican Disability Age Under 5

COMPARE

Immigrants from Eritrea
Race
Ancestry
AfghanAfricanAlaska NativeAlaskan AthabascanAlbanianAleutAlsatianAmericanApacheArabArapahoArgentineanArmenianAssyrian/Chaldean/SyriacAustralianAustrianBahamianBangladeshiBarbadianBasqueBelgianBelizeanBermudanBhutaneseBlackfeetBolivianBrazilianBritishBritish West IndianBulgarianBurmeseCajunCambodianCanadianCape VerdeanCarpatho RusynCelticCentral AmericanCentral American IndianCherokeeCheyenneChickasawChileanChineseChippewaChoctawColombianColvilleComancheCosta RicanCreeCreekCroatianCrowCubanCypriotCzechCzechoslovakianDanishDelawareDutchDutch West IndianEastern EuropeanEcuadorianEgyptianEnglishEstonianEthiopianEuropeanFijianFilipinoFinnishFrenchFrench American IndianFrench CanadianGermanGerman RussianGhanaianGreekGuamanian/ChamorroGuatemalanGuyaneseHaitianHmongHonduranHopiHoumaHungarianIcelanderIndian (Asian)IndonesianInupiatIranianIraqiIrishIroquoisIsraeliItalianJamaicanJapaneseJordanianKenyanKiowaKoreanLaotianLatvianLebaneseLiberianLithuanianLumbeeLuxembourgerMacedonianMalaysianMalteseMarshalleseMenomineeMexicanMexican American IndianMongolianMoroccanNative HawaiianNavajoNepaleseNew ZealanderNicaraguanNigerianNorthern EuropeanNorwegianOkinawanOsageOttawaPaiutePakistaniPalestinianPanamanianParaguayanPennsylvania GermanPeruvianPimaPolishPortuguesePotawatomiPuebloPuerto RicanPuget Sound SalishRomanianRussianSalvadoranSamoanScandinavianScotch-IrishScottishSeminoleSenegaleseSerbianShoshoneSierra LeoneanSiouxSlavicSlovakSloveneSomaliSouth AfricanSouth AmericanSouth American IndianSoviet UnionSpaniardSpanishSpanish AmericanSpanish American IndianSri LankanSubsaharan AfricanSudaneseSwedishSwissSyrianTaiwaneseThaiTlingit-HaidaTohono O'OdhamTonganTrinidadian and TobagonianTsimshianTurkishU.S. Virgin IslanderUgandanUkrainianUruguayanUteVenezuelanVietnameseWelshWest IndianYakamaYaquiYugoslavianYumanYup'ikZimbabwean
Immigration
NonimmigrantsImmigrantsAfghanistanAfricaAlbaniaArgentinaArmeniaAsiaAustraliaAustriaBahamasBangladeshBarbadosBelarusBelgiumBelizeBoliviaBosnia and HerzegovinaBrazilBulgariaBurma/MyanmarCabo VerdeCambodiaCameroonCanadaCaribbeanCentral AmericaChileChinaColombiaCongoCosta RicaCroatiaCubaCzechoslovakiaDenmarkDominicaDominican RepublicEastern AfricaEastern AsiaEastern EuropeEcuadorEgyptEl SalvadorEnglandEritreaEthiopiaEuropeFijiFranceGermanyGhanaGreeceGrenadaGuatemalaGuyanaHaitiHondurasHong KongHungaryIndiaIndonesiaIranIraqIrelandIsraelItalyJamaicaJapanJordanKazakhstanKenyaKoreaKuwaitLaosLatin AmericaLatviaLebanonLiberiaLithuaniaMalaysiaMexicoMicronesiaMiddle AfricaMoldovaMoroccoNepalNetherlandsNicaraguaNigeriaNorth AmericaNorth MacedoniaNorthern AfricaNorthern EuropeNorwayOceaniaPakistanPanamaPeruPhilippinesPolandPortugalRomaniaRussiaSaudi ArabiaScotlandSenegalSerbiaSierra LeoneSingaporeSomaliaSouth AfricaSouth AmericaSouth Central AsiaSouth Eastern AsiaSouthern EuropeSpainSri LankaSt. Vincent and the GrenadinesSudanSwedenSwitzerlandSyriaTaiwanThailandTrinidad and TobagoTurkeyUgandaUkraineUruguayUzbekistanVenezuelaVietnamWest IndiesWestern AfricaWestern AsiaWestern EuropeYemenZaireZimbabweAzores
Dominican
Race
Ancestry
AfghanAfricanAlaska NativeAlaskan AthabascanAlbanianAleutAlsatianAmericanApacheArabArapahoArgentineanArmenianAssyrian/Chaldean/SyriacAustralianAustrianBahamianBangladeshiBarbadianBasqueBelgianBelizeanBermudanBhutaneseBlackfeetBolivianBrazilianBritishBritish West IndianBulgarianBurmeseCajunCambodianCanadianCape VerdeanCarpatho RusynCelticCentral AmericanCentral American IndianCherokeeCheyenneChickasawChileanChineseChippewaChoctawColombianColvilleComancheCosta RicanCreeCreekCroatianCrowCubanCypriotCzechCzechoslovakianDanishDelawareDominicanDutchDutch West IndianEastern EuropeanEcuadorianEgyptianEnglishEstonianEthiopianEuropeanFijianFilipinoFinnishFrenchFrench American IndianFrench CanadianGermanGerman RussianGhanaianGreekGuamanian/ChamorroGuatemalanGuyaneseHaitianHmongHonduranHopiHoumaHungarianIcelanderIndian (Asian)IndonesianInupiatIranianIraqiIrishIroquoisIsraeliItalianJamaicanJapaneseJordanianKenyanKiowaKoreanLaotianLatvianLebaneseLiberianLithuanianLumbeeLuxembourgerMacedonianMalaysianMalteseMarshalleseMenomineeMexicanMexican American IndianMongolianMoroccanNative HawaiianNavajoNepaleseNew ZealanderNicaraguanNigerianNorthern EuropeanNorwegianOkinawanOsageOttawaPaiutePakistaniPalestinianPanamanianParaguayanPennsylvania GermanPeruvianPimaPolishPortuguesePotawatomiPuebloPuerto RicanPuget Sound SalishRomanianRussianSalvadoranSamoanScandinavianScotch-IrishScottishSeminoleSenegaleseSerbianShoshoneSierra LeoneanSiouxSlavicSlovakSloveneSomaliSouth AfricanSouth AmericanSouth American IndianSoviet UnionSpaniardSpanishSpanish AmericanSpanish American IndianSri LankanSubsaharan AfricanSudaneseSwedishSwissSyrianTaiwaneseThaiTlingit-HaidaTohono O'OdhamTonganTrinidadian and TobagonianTsimshianTurkishU.S. Virgin IslanderUgandanUkrainianUruguayanUteVenezuelanVietnameseWelshWest IndianYakamaYaquiYugoslavianYumanYup'ikZimbabwean
Immigration
NonimmigrantsImmigrantsAfghanistanAfricaAlbaniaArgentinaArmeniaAsiaAustraliaAustriaBahamasBangladeshBarbadosBelarusBelgiumBelizeBoliviaBosnia and HerzegovinaBrazilBulgariaBurma/MyanmarCabo VerdeCambodiaCameroonCanadaCaribbeanCentral AmericaChileChinaColombiaCongoCosta RicaCroatiaCubaCzechoslovakiaDenmarkDominicaDominican RepublicEastern AfricaEastern AsiaEastern EuropeEcuadorEgyptEl SalvadorEnglandEthiopiaEuropeFijiFranceGermanyGhanaGreeceGrenadaGuatemalaGuyanaHaitiHondurasHong KongHungaryIndiaIndonesiaIranIraqIrelandIsraelItalyJamaicaJapanJordanKazakhstanKenyaKoreaKuwaitLaosLatin AmericaLatviaLebanonLiberiaLithuaniaMalaysiaMexicoMicronesiaMiddle AfricaMoldovaMoroccoNepalNetherlandsNicaraguaNigeriaNorth AmericaNorth MacedoniaNorthern AfricaNorthern EuropeNorwayOceaniaPakistanPanamaPeruPhilippinesPolandPortugalRomaniaRussiaSaudi ArabiaScotlandSenegalSerbiaSierra LeoneSingaporeSomaliaSouth AfricaSouth AmericaSouth Central AsiaSouth Eastern AsiaSouthern EuropeSpainSri LankaSt. Vincent and the GrenadinesSudanSwedenSwitzerlandSyriaTaiwanThailandTrinidad and TobagoTurkeyUgandaUkraineUruguayUzbekistanVenezuelaVietnamWest IndiesWestern AfricaWestern AsiaWestern EuropeYemenZaireZimbabweAzores
Disability Age Under 5
Income
Poverty
Unemployment
Labor Participation
Family Structure
Vehicle Availability
Education Level
Disability

Disability Age Under 5 Comparison

Immigrants from Eritrea

Dominicans

Exceptional
Exceptional
1.2%
DISABILITY AGE UNDER 5
92.3/ 100
METRIC RATING
120th/ 347
METRIC RANK
1.1%
DISABILITY AGE UNDER 5
96.3/ 100
METRIC RATING
99th/ 347
METRIC RANK

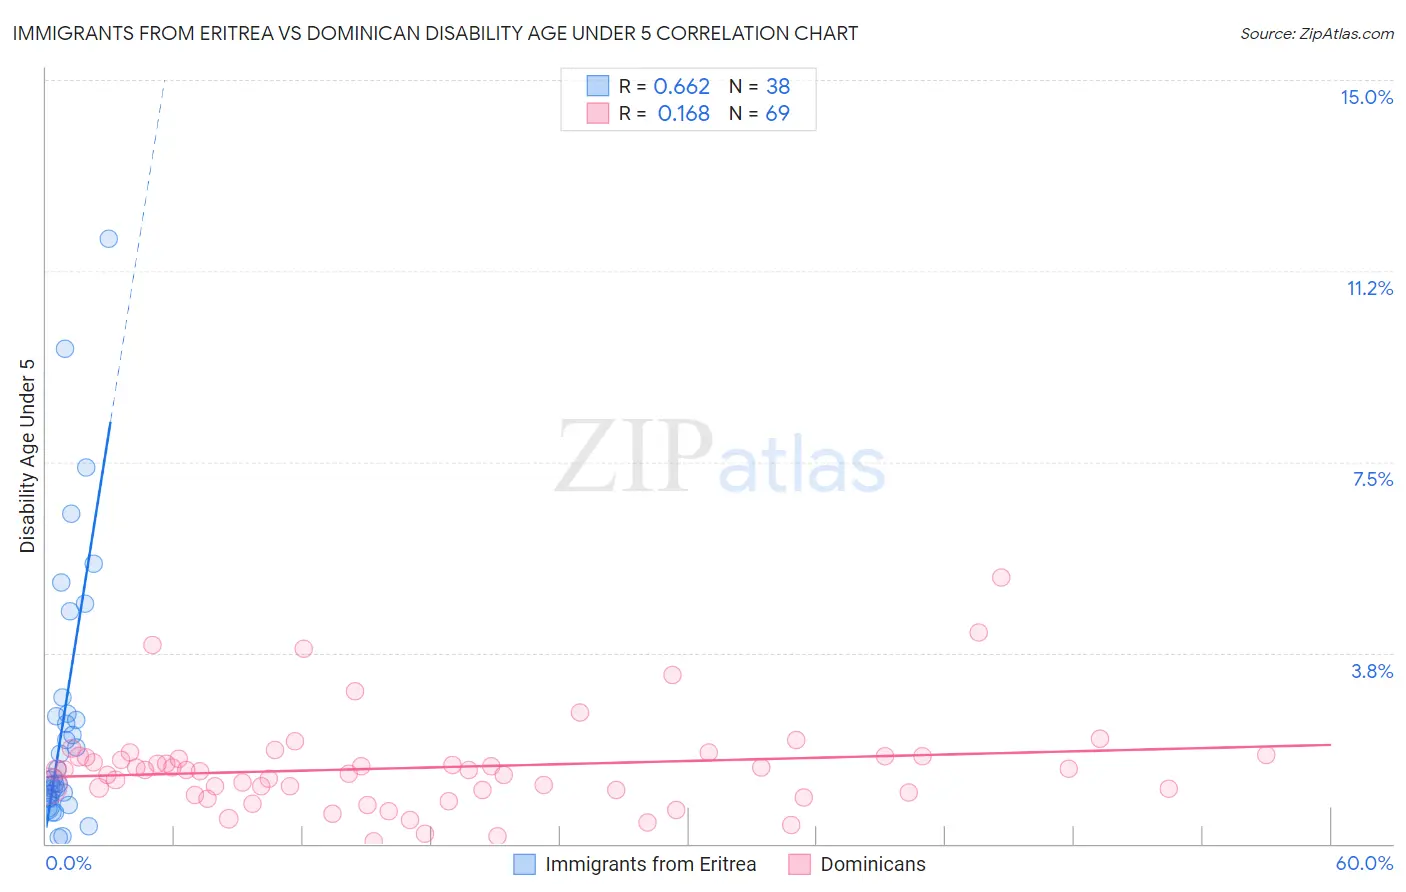
Immigrants from Eritrea vs Dominican Disability Age Under 5 Correlation Chart

The statistical analysis conducted on geographies consisting of 83,045,711 people shows a significant positive correlation between the proportion of Immigrants from Eritrea and percentage of population with a disability under the age of 5 in the United States with a correlation coefficient (R) of 0.662 and weighted average of 1.2%. Similarly, the statistical analysis conducted on geographies consisting of 197,745,211 people shows a poor positive correlation between the proportion of Dominicans and percentage of population with a disability under the age of 5 in the United States with a correlation coefficient (R) of 0.168 and weighted average of 1.1%, a difference of 1.9%.
Immigrants from Eritrea vs Dominican Disability Age Under 5

Disability Age Under 5 Correlation Summary

MeasurementImmigrants from EritreaDominican
Minimum0.12%0.058%
Maximum11.9%5.2%
Range11.8%5.2%
Mean2.5%1.5%
Median1.3%1.5%
Interquartile 25% (IQ1)0.90%1.0%
Interquartile 75% (IQ3)2.5%1.7%
Interquartile Range (IQR)1.6%0.68%
Standard Deviation (Sample)2.7%0.92%
Standard Deviation (Population)2.6%0.91%

Similar Demographics by Disability Age Under 5

Demographics Similar to Immigrants from Eritrea by Disability Age Under 5

In terms of disability age under 5, the demographic groups most similar to Immigrants from Eritrea are Bhutanese (1.2%, a difference of 0.070%), Immigrants from Senegal (1.2%, a difference of 0.28%), Immigrants from Venezuela (1.2%, a difference of 0.41%), Immigrants from Philippines (1.2%, a difference of 0.44%), and Aleut (1.2%, a difference of 0.47%).
DemographicsRating | RankDisability Age Under 5
Immigrants | Oceania
94.2
/100
|
#113
Exceptional
1.2%
Belizeans
93.9
/100
|
#114
Exceptional
1.2%
Immigrants | Caribbean
93.8
/100
|
#115
Exceptional
1.2%
Immigrants | Northern Africa
93.8
/100
|
#116
Exceptional
1.2%
Immigrants | Philippines
93.5
/100
|
#117
Exceptional
1.2%
Immigrants | Venezuela
93.4
/100
|
#118
Exceptional
1.2%
Bhutanese
92.5
/100
|
#119
Exceptional
1.2%
Immigrants | Eritrea
92.3
/100
|
#120
Exceptional
1.2%
Immigrants | Senegal
91.4
/100
|
#121
Exceptional
1.2%
Aleuts
90.7
/100
|
#122
Exceptional
1.2%
Zimbabweans
90.6
/100
|
#123
Exceptional
1.2%
Immigrants | Cambodia
90.5
/100
|
#124
Exceptional
1.2%
Japanese
90.3
/100
|
#125
Exceptional
1.2%
Central Americans
89.7
/100
|
#126
Excellent
1.2%
Immigrants | Romania
88.4
/100
|
#127
Excellent
1.2%

Demographics Similar to Dominicans by Disability Age Under 5

In terms of disability age under 5, the demographic groups most similar to Dominicans are Nicaraguan (1.1%, a difference of 0.030%), Immigrants from South Eastern Asia (1.1%, a difference of 0.13%), Immigrants from Iraq (1.1%, a difference of 0.14%), Immigrants from Uganda (1.1%, a difference of 0.14%), and Immigrants from Morocco (1.2%, a difference of 0.20%).
DemographicsRating | RankDisability Age Under 5
Immigrants | Cuba
97.0
/100
|
#92
Exceptional
1.1%
Spanish Americans
96.9
/100
|
#93
Exceptional
1.1%
Sri Lankans
96.8
/100
|
#94
Exceptional
1.1%
Immigrants | Moldova
96.8
/100
|
#95
Exceptional
1.1%
Mongolians
96.6
/100
|
#96
Exceptional
1.1%
Immigrants | Iraq
96.5
/100
|
#97
Exceptional
1.1%
Immigrants | South Eastern Asia
96.5
/100
|
#98
Exceptional
1.1%
Dominicans
96.3
/100
|
#99
Exceptional
1.1%
Nicaraguans
96.3
/100
|
#100
Exceptional
1.1%
Immigrants | Uganda
96.1
/100
|
#101
Exceptional
1.1%
Immigrants | Morocco
96.0
/100
|
#102
Exceptional
1.2%
Immigrants | Nicaragua
96.0
/100
|
#103
Exceptional
1.2%
Indonesians
95.9
/100
|
#104
Exceptional
1.2%
Immigrants | South Africa
95.6
/100
|
#105
Exceptional
1.2%
Cambodians
95.4
/100
|
#106
Exceptional
1.2%