Immigrants from Australia vs Yuman Self-Care Disability
COMPARE
Immigrants from Australia
Yuman
Self-Care Disability
Self-Care Disability Comparison
Immigrants from Australia
Yuman
2.3%
SELF-CARE DISABILITY
99.9/ 100
METRIC RATING
35th/ 347
METRIC RANK
2.6%
SELF-CARE DISABILITY
0.8/ 100
METRIC RATING
244th/ 347
METRIC RANK
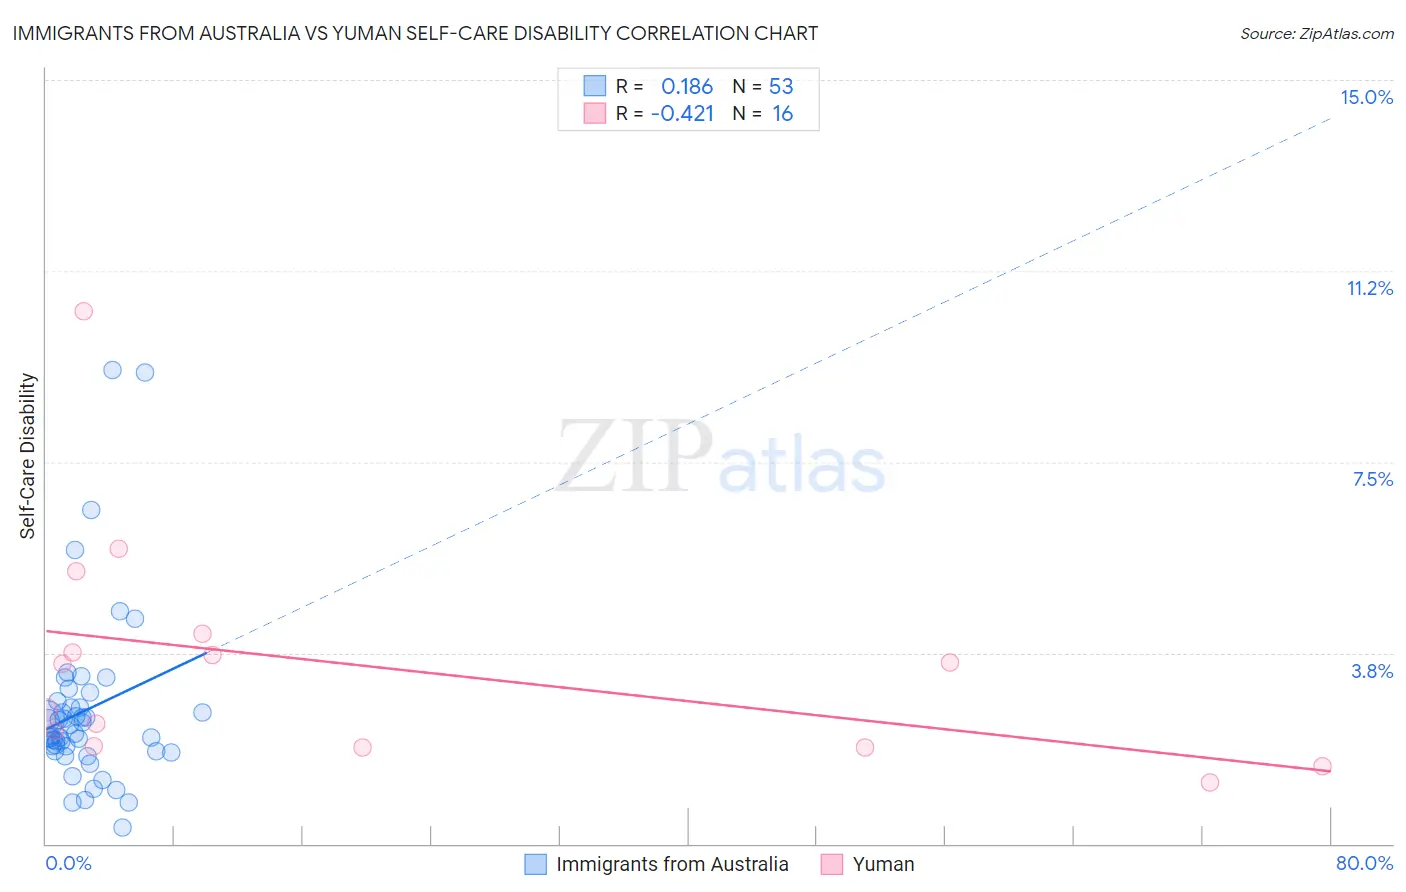
Immigrants from Australia vs Yuman Self-Care Disability Correlation Chart
The statistical analysis conducted on geographies consisting of 227,025,526 people shows a poor positive correlation between the proportion of Immigrants from Australia and percentage of population with self-care disability in the United States with a correlation coefficient (R) of 0.186 and weighted average of 2.3%. Similarly, the statistical analysis conducted on geographies consisting of 40,644,588 people shows a moderate negative correlation between the proportion of Yuman and percentage of population with self-care disability in the United States with a correlation coefficient (R) of -0.421 and weighted average of 2.6%, a difference of 15.1%.
Self-Care Disability Correlation Summary
| Measurement | Immigrants from Australia | Yuman |
| Minimum | 0.32% | 1.2% |
| Maximum | 9.3% | 10.5% |
| Range | 9.0% | 9.3% |
| Mean | 2.6% | 3.5% |
| Median | 2.2% | 3.1% |
| Interquartile 25% (IQ1) | 1.8% | 1.9% |
| Interquartile 75% (IQ3) | 2.7% | 3.9% |
| Interquartile Range (IQR) | 0.93% | 2.0% |
| Standard Deviation (Sample) | 1.7% | 2.3% |
| Standard Deviation (Population) | 1.7% | 2.2% |
Similar Demographics by Self-Care Disability
Demographics Similar to Immigrants from Australia by Self-Care Disability
In terms of self-care disability, the demographic groups most similar to Immigrants from Australia are Immigrants from Lithuania (2.3%, a difference of 0.010%), Immigrants from Turkey (2.3%, a difference of 0.060%), Immigrants from Korea (2.3%, a difference of 0.12%), Immigrants from Sweden (2.3%, a difference of 0.18%), and Immigrants from Eastern Africa (2.3%, a difference of 0.31%).
| Demographics | Rating | Rank | Self-Care Disability |
| Inupiat | 99.9 /100 | #28 | Exceptional 2.2% |
| Immigrants | Zimbabwe | 99.9 /100 | #29 | Exceptional 2.3% |
| Paraguayans | 99.9 /100 | #30 | Exceptional 2.3% |
| Danes | 99.9 /100 | #31 | Exceptional 2.3% |
| Burmese | 99.9 /100 | #32 | Exceptional 2.3% |
| Immigrants | Korea | 99.9 /100 | #33 | Exceptional 2.3% |
| Immigrants | Turkey | 99.9 /100 | #34 | Exceptional 2.3% |
| Immigrants | Australia | 99.9 /100 | #35 | Exceptional 2.3% |
| Immigrants | Lithuania | 99.9 /100 | #36 | Exceptional 2.3% |
| Immigrants | Sweden | 99.9 /100 | #37 | Exceptional 2.3% |
| Immigrants | Eastern Africa | 99.9 /100 | #38 | Exceptional 2.3% |
| Immigrants | Bulgaria | 99.8 /100 | #39 | Exceptional 2.3% |
| Iranians | 99.8 /100 | #40 | Exceptional 2.3% |
| Immigrants | Sudan | 99.8 /100 | #41 | Exceptional 2.3% |
| Immigrants | Uganda | 99.8 /100 | #42 | Exceptional 2.3% |
Demographics Similar to Yuman by Self-Care Disability
In terms of self-care disability, the demographic groups most similar to Yuman are Hawaiian (2.6%, a difference of 0.040%), Spanish (2.6%, a difference of 0.11%), Immigrants from Western Asia (2.6%, a difference of 0.19%), Cheyenne (2.6%, a difference of 0.21%), and Immigrants from Albania (2.6%, a difference of 0.33%).
| Demographics | Rating | Rank | Self-Care Disability |
| Immigrants | Senegal | 1.6 /100 | #237 | Tragic 2.6% |
| Senegalese | 1.3 /100 | #238 | Tragic 2.6% |
| Immigrants | Panama | 1.2 /100 | #239 | Tragic 2.6% |
| Marshallese | 1.2 /100 | #240 | Tragic 2.6% |
| Immigrants | Syria | 1.0 /100 | #241 | Tragic 2.6% |
| Spanish | 0.8 /100 | #242 | Tragic 2.6% |
| Hawaiians | 0.8 /100 | #243 | Tragic 2.6% |
| Yuman | 0.8 /100 | #244 | Tragic 2.6% |
| Immigrants | Western Asia | 0.6 /100 | #245 | Tragic 2.6% |
| Cheyenne | 0.6 /100 | #246 | Tragic 2.6% |
| Immigrants | Albania | 0.6 /100 | #247 | Tragic 2.6% |
| Nicaraguans | 0.6 /100 | #248 | Tragic 2.6% |
| Mexican American Indians | 0.5 /100 | #249 | Tragic 2.6% |
| Portuguese | 0.4 /100 | #250 | Tragic 2.6% |
| Immigrants | Liberia | 0.4 /100 | #251 | Tragic 2.6% |