Immigrants from Uganda vs Immigrants from Hungary Disability
COMPARE
Immigrants from Uganda
Immigrants from Hungary
Disability
Disability Comparison
Immigrants from Uganda
Immigrants from Hungary
11.3%
DISABILITY
95.7/ 100
METRIC RATING
109th/ 347
METRIC RANK
11.5%
DISABILITY
79.0/ 100
METRIC RATING
146th/ 347
METRIC RANK
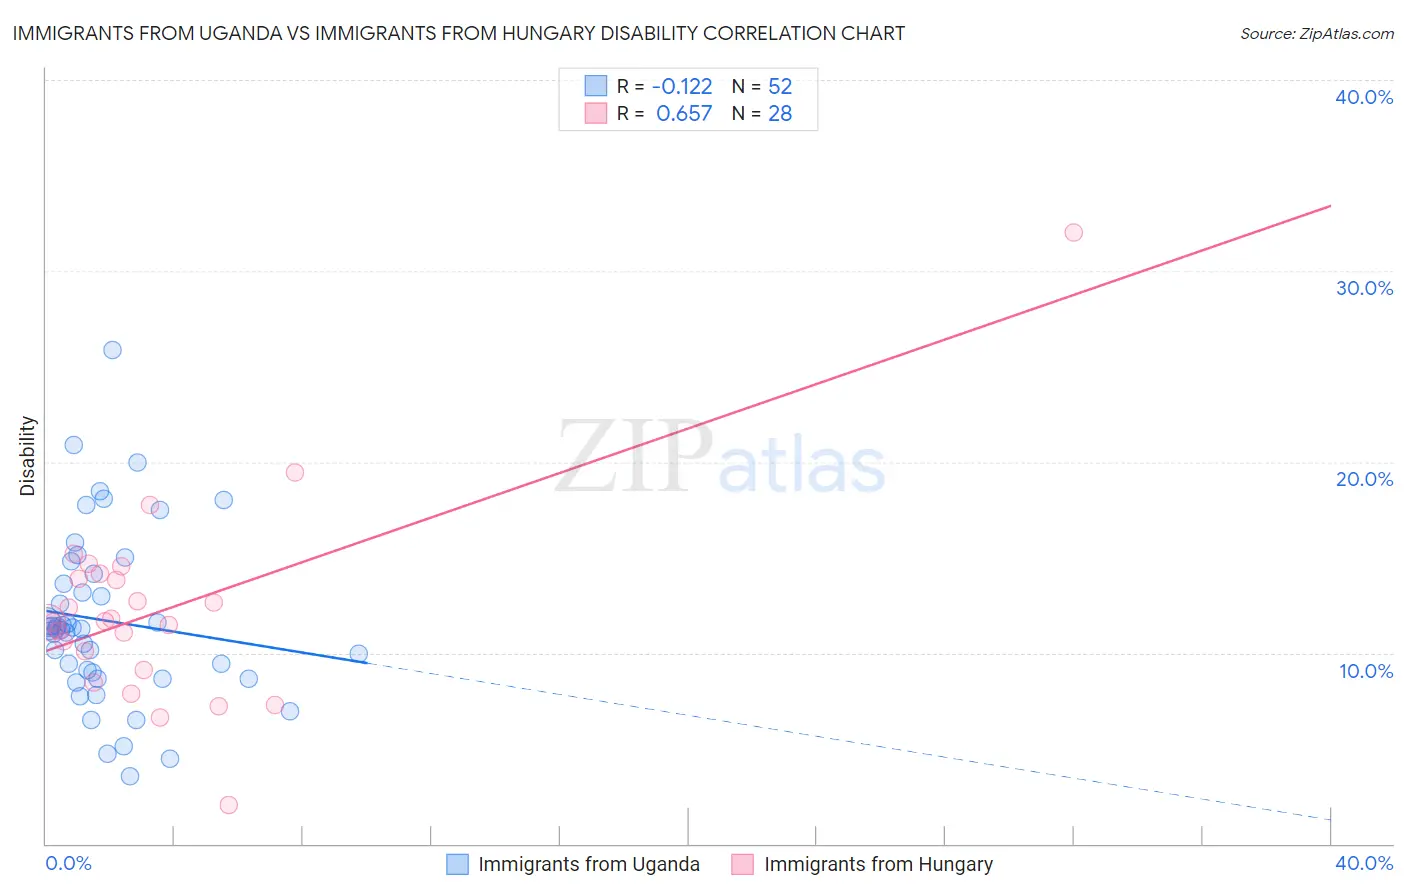
Immigrants from Uganda vs Immigrants from Hungary Disability Correlation Chart
The statistical analysis conducted on geographies consisting of 125,981,344 people shows a poor negative correlation between the proportion of Immigrants from Uganda and percentage of population with a disability in the United States with a correlation coefficient (R) of -0.122 and weighted average of 11.3%. Similarly, the statistical analysis conducted on geographies consisting of 195,708,395 people shows a significant positive correlation between the proportion of Immigrants from Hungary and percentage of population with a disability in the United States with a correlation coefficient (R) of 0.657 and weighted average of 11.5%, a difference of 2.0%.
Disability Correlation Summary
| Measurement | Immigrants from Uganda | Immigrants from Hungary |
| Minimum | 3.5% | 2.0% |
| Maximum | 25.9% | 32.0% |
| Range | 22.4% | 30.0% |
| Mean | 11.7% | 12.2% |
| Median | 11.3% | 11.6% |
| Interquartile 25% (IQ1) | 8.8% | 9.6% |
| Interquartile 75% (IQ3) | 13.9% | 14.0% |
| Interquartile Range (IQR) | 5.1% | 4.4% |
| Standard Deviation (Sample) | 4.4% | 5.2% |
| Standard Deviation (Population) | 4.4% | 5.1% |
Similar Demographics by Disability
Demographics Similar to Immigrants from Uganda by Disability
In terms of disability, the demographic groups most similar to Immigrants from Uganda are Immigrants from Denmark (11.3%, a difference of 0.020%), Immigrants from Nigeria (11.3%, a difference of 0.080%), Immigrants from South Eastern Asia (11.3%, a difference of 0.080%), Nicaraguan (11.3%, a difference of 0.16%), and Immigrants from Eastern Europe (11.3%, a difference of 0.18%).
| Demographics | Rating | Rank | Disability |
| Immigrants | Eastern Africa | 96.7 /100 | #102 | Exceptional 11.3% |
| Immigrants | Uruguay | 96.4 /100 | #103 | Exceptional 11.3% |
| Immigrants | Immigrants | 96.4 /100 | #104 | Exceptional 11.3% |
| Immigrants | Kazakhstan | 96.4 /100 | #105 | Exceptional 11.3% |
| Immigrants | Eastern Europe | 96.3 /100 | #106 | Exceptional 11.3% |
| Nicaraguans | 96.2 /100 | #107 | Exceptional 11.3% |
| Immigrants | Nigeria | 96.0 /100 | #108 | Exceptional 11.3% |
| Immigrants | Uganda | 95.7 /100 | #109 | Exceptional 11.3% |
| Immigrants | Denmark | 95.6 /100 | #110 | Exceptional 11.3% |
| Immigrants | South Eastern Asia | 95.4 /100 | #111 | Exceptional 11.3% |
| Immigrants | Uzbekistan | 94.9 /100 | #112 | Exceptional 11.3% |
| Guyanese | 94.7 /100 | #113 | Exceptional 11.3% |
| Immigrants | Syria | 94.7 /100 | #114 | Exceptional 11.3% |
| Immigrants | Philippines | 94.6 /100 | #115 | Exceptional 11.3% |
| Immigrants | Northern Europe | 94.1 /100 | #116 | Exceptional 11.3% |
Demographics Similar to Immigrants from Hungary by Disability
In terms of disability, the demographic groups most similar to Immigrants from Hungary are Immigrants from Ukraine (11.5%, a difference of 0.090%), Sudanese (11.5%, a difference of 0.12%), Nigerian (11.5%, a difference of 0.16%), Australian (11.5%, a difference of 0.25%), and Moroccan (11.5%, a difference of 0.32%).
| Demographics | Rating | Rank | Disability |
| Ghanaians | 87.0 /100 | #139 | Excellent 11.5% |
| Russians | 86.8 /100 | #140 | Excellent 11.5% |
| Immigrants | Grenada | 86.1 /100 | #141 | Excellent 11.5% |
| Immigrants | Sudan | 85.3 /100 | #142 | Excellent 11.5% |
| Moroccans | 83.3 /100 | #143 | Excellent 11.5% |
| Australians | 82.5 /100 | #144 | Excellent 11.5% |
| Nigerians | 81.3 /100 | #145 | Excellent 11.5% |
| Immigrants | Hungary | 79.0 /100 | #146 | Good 11.5% |
| Immigrants | Ukraine | 77.6 /100 | #147 | Good 11.5% |
| Sudanese | 77.1 /100 | #148 | Good 11.5% |
| Immigrants | Norway | 73.2 /100 | #149 | Good 11.6% |
| Romanians | 72.7 /100 | #150 | Good 11.6% |
| Immigrants | Kenya | 72.1 /100 | #151 | Good 11.6% |
| Immigrants | Moldova | 72.0 /100 | #152 | Good 11.6% |
| Immigrants | Ghana | 71.2 /100 | #153 | Good 11.6% |