Immigrants from Cambodia vs Immigrants from Hungary Disability Age 65 to 74
COMPARE
Immigrants from Cambodia
Immigrants from Hungary
Disability Age 65 to 74
Disability Age 65 to 74 Comparison
Immigrants from Cambodia
Immigrants from Hungary
25.3%
DISABILITY AGE 65 TO 74
0.3/ 100
METRIC RATING
259th/ 347
METRIC RANK
21.7%
DISABILITY AGE 65 TO 74
99.2/ 100
METRIC RATING
72nd/ 347
METRIC RANK
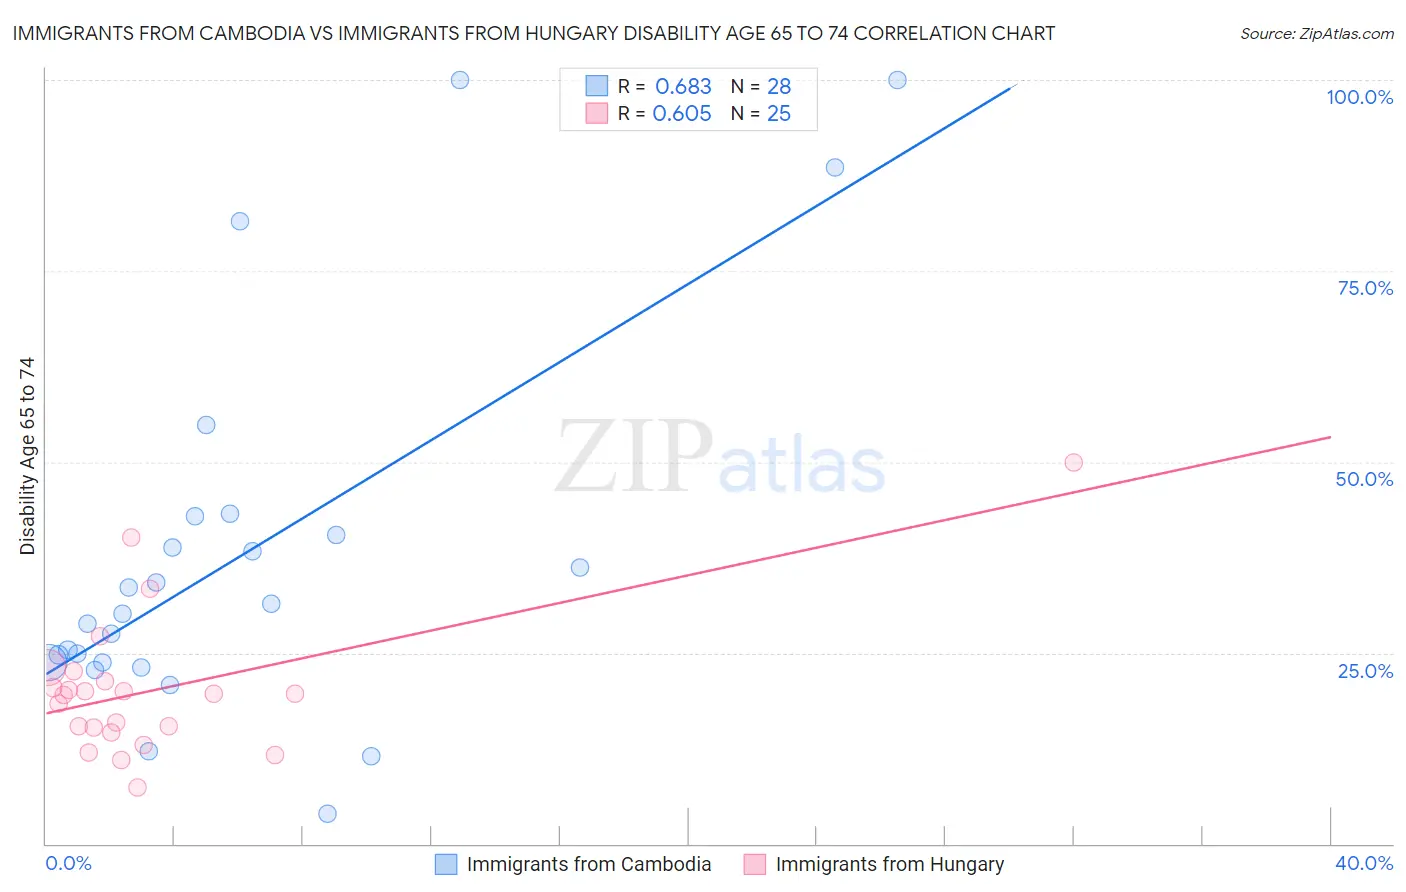
Immigrants from Cambodia vs Immigrants from Hungary Disability Age 65 to 74 Correlation Chart
The statistical analysis conducted on geographies consisting of 205,056,933 people shows a significant positive correlation between the proportion of Immigrants from Cambodia and percentage of population with a disability between the ages 65 and 75 in the United States with a correlation coefficient (R) of 0.683 and weighted average of 25.3%. Similarly, the statistical analysis conducted on geographies consisting of 195,586,692 people shows a significant positive correlation between the proportion of Immigrants from Hungary and percentage of population with a disability between the ages 65 and 75 in the United States with a correlation coefficient (R) of 0.605 and weighted average of 21.7%, a difference of 16.6%.
Disability Age 65 to 74 Correlation Summary
| Measurement | Immigrants from Cambodia | Immigrants from Hungary |
| Minimum | 4.0% | 7.3% |
| Maximum | 100.0% | 50.0% |
| Range | 96.0% | 42.7% |
| Mean | 38.1% | 20.3% |
| Median | 30.8% | 19.6% |
| Interquartile 25% (IQ1) | 23.8% | 14.9% |
| Interquartile 75% (IQ3) | 41.6% | 21.9% |
| Interquartile Range (IQR) | 17.9% | 7.0% |
| Standard Deviation (Sample) | 25.1% | 9.3% |
| Standard Deviation (Population) | 24.6% | 9.2% |
Similar Demographics by Disability Age 65 to 74
Demographics Similar to Immigrants from Cambodia by Disability Age 65 to 74
In terms of disability age 65 to 74, the demographic groups most similar to Immigrants from Cambodia are Marshallese (25.3%, a difference of 0.090%), Guamanian/Chamorro (25.3%, a difference of 0.15%), Immigrants from Somalia (25.2%, a difference of 0.32%), Malaysian (25.4%, a difference of 0.32%), and Cape Verdean (25.4%, a difference of 0.40%).
| Demographics | Rating | Rank | Disability Age 65 to 74 |
| Immigrants | El Salvador | 0.6 /100 | #252 | Tragic 25.1% |
| Sub-Saharan Africans | 0.6 /100 | #253 | Tragic 25.1% |
| Somalis | 0.6 /100 | #254 | Tragic 25.1% |
| Central Americans | 0.5 /100 | #255 | Tragic 25.1% |
| Immigrants | Somalia | 0.4 /100 | #256 | Tragic 25.2% |
| Guamanians/Chamorros | 0.3 /100 | #257 | Tragic 25.3% |
| Marshallese | 0.3 /100 | #258 | Tragic 25.3% |
| Immigrants | Cambodia | 0.3 /100 | #259 | Tragic 25.3% |
| Malaysians | 0.2 /100 | #260 | Tragic 25.4% |
| Cape Verdeans | 0.2 /100 | #261 | Tragic 25.4% |
| Samoans | 0.2 /100 | #262 | Tragic 25.4% |
| Iroquois | 0.2 /100 | #263 | Tragic 25.4% |
| Hawaiians | 0.2 /100 | #264 | Tragic 25.5% |
| Guatemalans | 0.2 /100 | #265 | Tragic 25.5% |
| Immigrants | Latin America | 0.1 /100 | #266 | Tragic 25.6% |
Demographics Similar to Immigrants from Hungary by Disability Age 65 to 74
In terms of disability age 65 to 74, the demographic groups most similar to Immigrants from Hungary are Immigrants from Belarus (21.7%, a difference of 0.010%), Immigrants from Egypt (21.7%, a difference of 0.070%), Chinese (21.7%, a difference of 0.070%), Immigrants from Venezuela (21.8%, a difference of 0.19%), and Immigrants from Scotland (21.7%, a difference of 0.20%).
| Demographics | Rating | Rank | Disability Age 65 to 74 |
| Immigrants | Russia | 99.4 /100 | #65 | Exceptional 21.6% |
| Maltese | 99.4 /100 | #66 | Exceptional 21.6% |
| Immigrants | South Africa | 99.3 /100 | #67 | Exceptional 21.7% |
| Immigrants | Scotland | 99.3 /100 | #68 | Exceptional 21.7% |
| Immigrants | Egypt | 99.2 /100 | #69 | Exceptional 21.7% |
| Chinese | 99.2 /100 | #70 | Exceptional 21.7% |
| Immigrants | Belarus | 99.2 /100 | #71 | Exceptional 21.7% |
| Immigrants | Hungary | 99.2 /100 | #72 | Exceptional 21.7% |
| Immigrants | Venezuela | 99.0 /100 | #73 | Exceptional 21.8% |
| Cambodians | 99.0 /100 | #74 | Exceptional 21.8% |
| Mongolians | 99.0 /100 | #75 | Exceptional 21.8% |
| Greeks | 99.0 /100 | #76 | Exceptional 21.8% |
| Immigrants | Poland | 99.0 /100 | #77 | Exceptional 21.8% |
| Immigrants | Eastern Europe | 99.0 /100 | #78 | Exceptional 21.8% |
| Venezuelans | 99.0 /100 | #79 | Exceptional 21.8% |