Immigrants from Cambodia vs Immigrants from Cuba Disability Age 65 to 74
COMPARE
Immigrants from Cambodia
Immigrants from Cuba
Disability Age 65 to 74
Disability Age 65 to 74 Comparison
Immigrants from Cambodia
Immigrants from Cuba
25.3%
DISABILITY AGE 65 TO 74
0.3/ 100
METRIC RATING
259th/ 347
METRIC RANK
23.6%
DISABILITY AGE 65 TO 74
34.0/ 100
METRIC RATING
188th/ 347
METRIC RANK
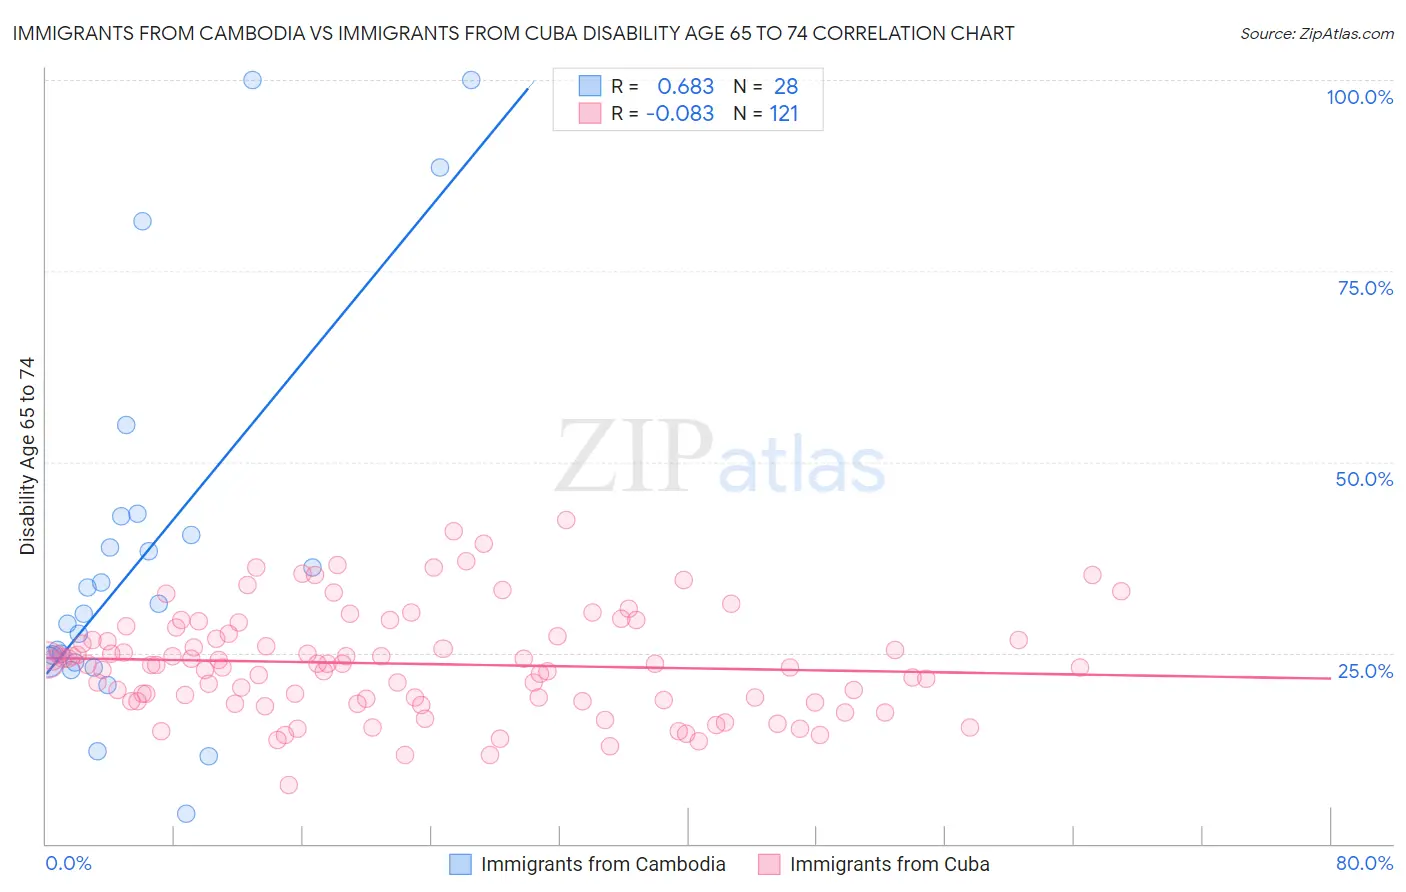
Immigrants from Cambodia vs Immigrants from Cuba Disability Age 65 to 74 Correlation Chart
The statistical analysis conducted on geographies consisting of 205,056,933 people shows a significant positive correlation between the proportion of Immigrants from Cambodia and percentage of population with a disability between the ages 65 and 75 in the United States with a correlation coefficient (R) of 0.683 and weighted average of 25.3%. Similarly, the statistical analysis conducted on geographies consisting of 325,637,866 people shows a slight negative correlation between the proportion of Immigrants from Cuba and percentage of population with a disability between the ages 65 and 75 in the United States with a correlation coefficient (R) of -0.083 and weighted average of 23.6%, a difference of 7.5%.
Disability Age 65 to 74 Correlation Summary
| Measurement | Immigrants from Cambodia | Immigrants from Cuba |
| Minimum | 4.0% | 7.7% |
| Maximum | 100.0% | 42.5% |
| Range | 96.0% | 34.8% |
| Mean | 38.1% | 23.6% |
| Median | 30.8% | 23.5% |
| Interquartile 25% (IQ1) | 23.8% | 18.6% |
| Interquartile 75% (IQ3) | 41.6% | 27.4% |
| Interquartile Range (IQR) | 17.9% | 8.8% |
| Standard Deviation (Sample) | 25.1% | 6.8% |
| Standard Deviation (Population) | 24.6% | 6.8% |
Similar Demographics by Disability Age 65 to 74
Demographics Similar to Immigrants from Cambodia by Disability Age 65 to 74
In terms of disability age 65 to 74, the demographic groups most similar to Immigrants from Cambodia are Marshallese (25.3%, a difference of 0.090%), Guamanian/Chamorro (25.3%, a difference of 0.15%), Immigrants from Somalia (25.2%, a difference of 0.32%), Malaysian (25.4%, a difference of 0.32%), and Cape Verdean (25.4%, a difference of 0.40%).
| Demographics | Rating | Rank | Disability Age 65 to 74 |
| Immigrants | El Salvador | 0.6 /100 | #252 | Tragic 25.1% |
| Sub-Saharan Africans | 0.6 /100 | #253 | Tragic 25.1% |
| Somalis | 0.6 /100 | #254 | Tragic 25.1% |
| Central Americans | 0.5 /100 | #255 | Tragic 25.1% |
| Immigrants | Somalia | 0.4 /100 | #256 | Tragic 25.2% |
| Guamanians/Chamorros | 0.3 /100 | #257 | Tragic 25.3% |
| Marshallese | 0.3 /100 | #258 | Tragic 25.3% |
| Immigrants | Cambodia | 0.3 /100 | #259 | Tragic 25.3% |
| Malaysians | 0.2 /100 | #260 | Tragic 25.4% |
| Cape Verdeans | 0.2 /100 | #261 | Tragic 25.4% |
| Samoans | 0.2 /100 | #262 | Tragic 25.4% |
| Iroquois | 0.2 /100 | #263 | Tragic 25.4% |
| Hawaiians | 0.2 /100 | #264 | Tragic 25.5% |
| Guatemalans | 0.2 /100 | #265 | Tragic 25.5% |
| Immigrants | Latin America | 0.1 /100 | #266 | Tragic 25.6% |
Demographics Similar to Immigrants from Cuba by Disability Age 65 to 74
In terms of disability age 65 to 74, the demographic groups most similar to Immigrants from Cuba are Scottish (23.6%, a difference of 0.060%), Immigrants from Guyana (23.6%, a difference of 0.18%), Portuguese (23.5%, a difference of 0.24%), Immigrants from Bangladesh (23.6%, a difference of 0.25%), and Basque (23.5%, a difference of 0.27%).
| Demographics | Rating | Rank | Disability Age 65 to 74 |
| Assyrians/Chaldeans/Syriacs | 45.3 /100 | #181 | Average 23.4% |
| Irish | 44.4 /100 | #182 | Average 23.4% |
| Immigrants | Eastern Africa | 42.8 /100 | #183 | Average 23.4% |
| Immigrants | Germany | 42.5 /100 | #184 | Average 23.4% |
| Haitians | 42.4 /100 | #185 | Average 23.4% |
| Basques | 38.4 /100 | #186 | Fair 23.5% |
| Portuguese | 37.8 /100 | #187 | Fair 23.5% |
| Immigrants | Cuba | 34.0 /100 | #188 | Fair 23.6% |
| Scottish | 33.1 /100 | #189 | Fair 23.6% |
| Immigrants | Guyana | 31.2 /100 | #190 | Fair 23.6% |
| Immigrants | Bangladesh | 30.2 /100 | #191 | Fair 23.6% |
| Ecuadorians | 29.7 /100 | #192 | Fair 23.6% |
| English | 28.5 /100 | #193 | Fair 23.6% |
| Sudanese | 27.8 /100 | #194 | Fair 23.7% |
| Immigrants | St. Vincent and the Grenadines | 26.1 /100 | #195 | Fair 23.7% |