Immigrants from Cambodia vs Paraguayan Disability Age 65 to 74
COMPARE
Immigrants from Cambodia
Paraguayan
Disability Age 65 to 74
Disability Age 65 to 74 Comparison
Immigrants from Cambodia
Paraguayans
25.3%
DISABILITY AGE 65 TO 74
0.3/ 100
METRIC RATING
259th/ 347
METRIC RANK
20.5%
DISABILITY AGE 65 TO 74
100.0/ 100
METRIC RATING
15th/ 347
METRIC RANK
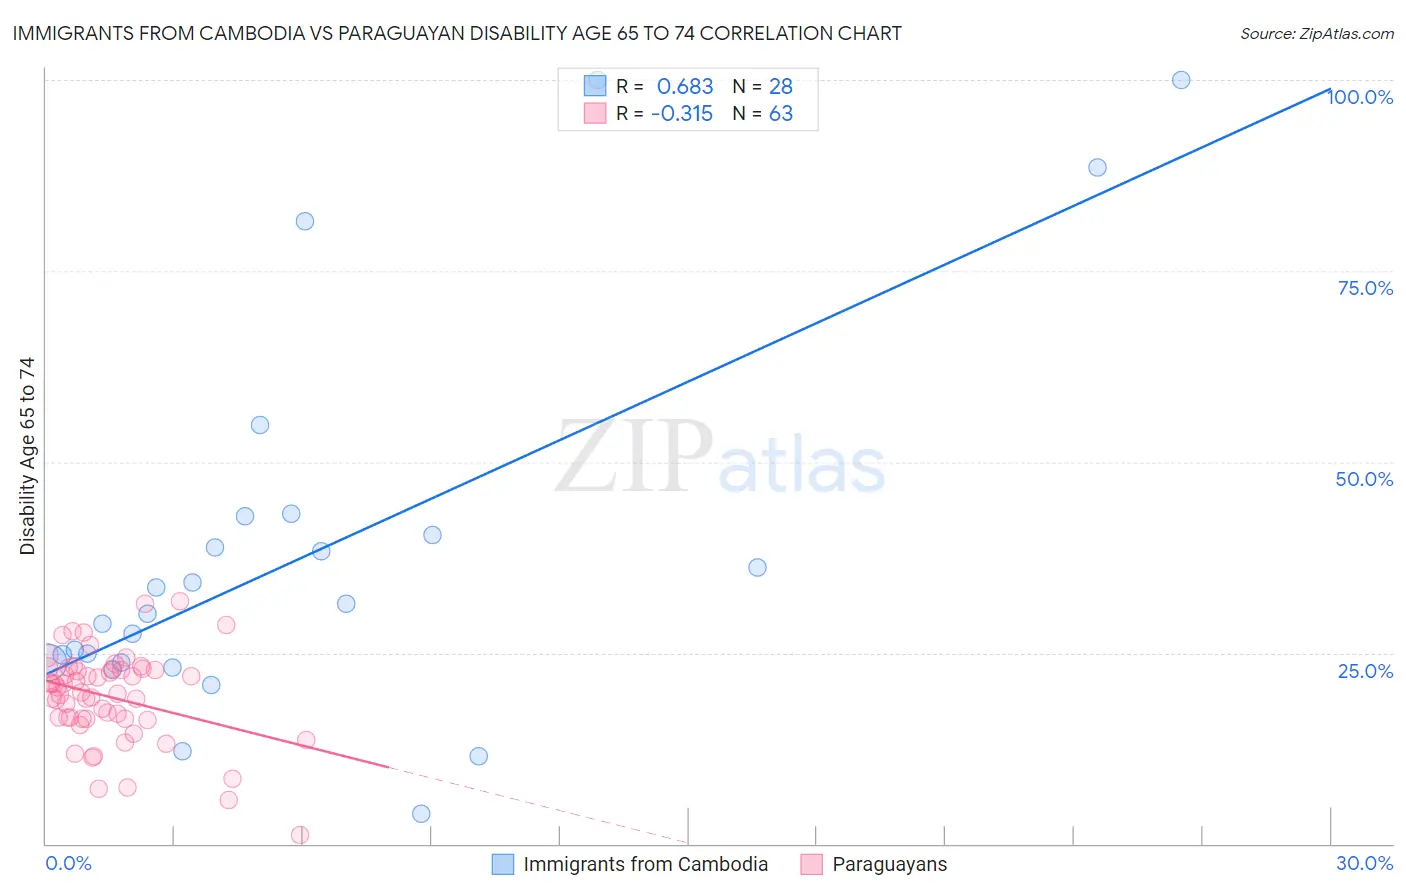
Immigrants from Cambodia vs Paraguayan Disability Age 65 to 74 Correlation Chart
The statistical analysis conducted on geographies consisting of 205,056,933 people shows a significant positive correlation between the proportion of Immigrants from Cambodia and percentage of population with a disability between the ages 65 and 75 in the United States with a correlation coefficient (R) of 0.683 and weighted average of 25.3%. Similarly, the statistical analysis conducted on geographies consisting of 95,081,049 people shows a mild negative correlation between the proportion of Paraguayans and percentage of population with a disability between the ages 65 and 75 in the United States with a correlation coefficient (R) of -0.315 and weighted average of 20.5%, a difference of 23.3%.
Disability Age 65 to 74 Correlation Summary
| Measurement | Immigrants from Cambodia | Paraguayan |
| Minimum | 4.0% | 1.2% |
| Maximum | 100.0% | 31.8% |
| Range | 96.0% | 30.6% |
| Mean | 38.1% | 19.2% |
| Median | 30.8% | 19.8% |
| Interquartile 25% (IQ1) | 23.8% | 16.3% |
| Interquartile 75% (IQ3) | 41.6% | 22.9% |
| Interquartile Range (IQR) | 17.9% | 6.5% |
| Standard Deviation (Sample) | 25.1% | 6.0% |
| Standard Deviation (Population) | 24.6% | 5.9% |
Similar Demographics by Disability Age 65 to 74
Demographics Similar to Immigrants from Cambodia by Disability Age 65 to 74
In terms of disability age 65 to 74, the demographic groups most similar to Immigrants from Cambodia are Marshallese (25.3%, a difference of 0.090%), Guamanian/Chamorro (25.3%, a difference of 0.15%), Immigrants from Somalia (25.2%, a difference of 0.32%), Malaysian (25.4%, a difference of 0.32%), and Cape Verdean (25.4%, a difference of 0.40%).
| Demographics | Rating | Rank | Disability Age 65 to 74 |
| Immigrants | El Salvador | 0.6 /100 | #252 | Tragic 25.1% |
| Sub-Saharan Africans | 0.6 /100 | #253 | Tragic 25.1% |
| Somalis | 0.6 /100 | #254 | Tragic 25.1% |
| Central Americans | 0.5 /100 | #255 | Tragic 25.1% |
| Immigrants | Somalia | 0.4 /100 | #256 | Tragic 25.2% |
| Guamanians/Chamorros | 0.3 /100 | #257 | Tragic 25.3% |
| Marshallese | 0.3 /100 | #258 | Tragic 25.3% |
| Immigrants | Cambodia | 0.3 /100 | #259 | Tragic 25.3% |
| Malaysians | 0.2 /100 | #260 | Tragic 25.4% |
| Cape Verdeans | 0.2 /100 | #261 | Tragic 25.4% |
| Samoans | 0.2 /100 | #262 | Tragic 25.4% |
| Iroquois | 0.2 /100 | #263 | Tragic 25.4% |
| Hawaiians | 0.2 /100 | #264 | Tragic 25.5% |
| Guatemalans | 0.2 /100 | #265 | Tragic 25.5% |
| Immigrants | Latin America | 0.1 /100 | #266 | Tragic 25.6% |
Demographics Similar to Paraguayans by Disability Age 65 to 74
In terms of disability age 65 to 74, the demographic groups most similar to Paraguayans are Indian (Asian) (20.5%, a difference of 0.020%), Immigrants from Lithuania (20.5%, a difference of 0.060%), Immigrants from South Central Asia (20.6%, a difference of 0.31%), Eastern European (20.6%, a difference of 0.38%), and Burmese (20.6%, a difference of 0.41%).
| Demographics | Rating | Rank | Disability Age 65 to 74 |
| Thais | 100.0 /100 | #8 | Exceptional 20.1% |
| Immigrants | China | 100.0 /100 | #9 | Exceptional 20.3% |
| Immigrants | Eastern Asia | 100.0 /100 | #10 | Exceptional 20.3% |
| Immigrants | Ireland | 100.0 /100 | #11 | Exceptional 20.3% |
| Immigrants | Korea | 100.0 /100 | #12 | Exceptional 20.4% |
| Immigrants | Singapore | 100.0 /100 | #13 | Exceptional 20.4% |
| Indians (Asian) | 100.0 /100 | #14 | Exceptional 20.5% |
| Paraguayans | 100.0 /100 | #15 | Exceptional 20.5% |
| Immigrants | Lithuania | 100.0 /100 | #16 | Exceptional 20.5% |
| Immigrants | South Central Asia | 100.0 /100 | #17 | Exceptional 20.6% |
| Eastern Europeans | 100.0 /100 | #18 | Exceptional 20.6% |
| Burmese | 100.0 /100 | #19 | Exceptional 20.6% |
| Okinawans | 100.0 /100 | #20 | Exceptional 20.7% |
| Immigrants | Bolivia | 99.9 /100 | #21 | Exceptional 20.8% |
| Immigrants | Iran | 99.9 /100 | #22 | Exceptional 20.9% |