Immigrants from Cambodia vs Norwegian Disability Age 65 to 74
COMPARE
Immigrants from Cambodia
Norwegian
Disability Age 65 to 74
Disability Age 65 to 74 Comparison
Immigrants from Cambodia
Norwegians
25.3%
DISABILITY AGE 65 TO 74
0.3/ 100
METRIC RATING
259th/ 347
METRIC RANK
22.5%
DISABILITY AGE 65 TO 74
92.5/ 100
METRIC RATING
124th/ 347
METRIC RANK
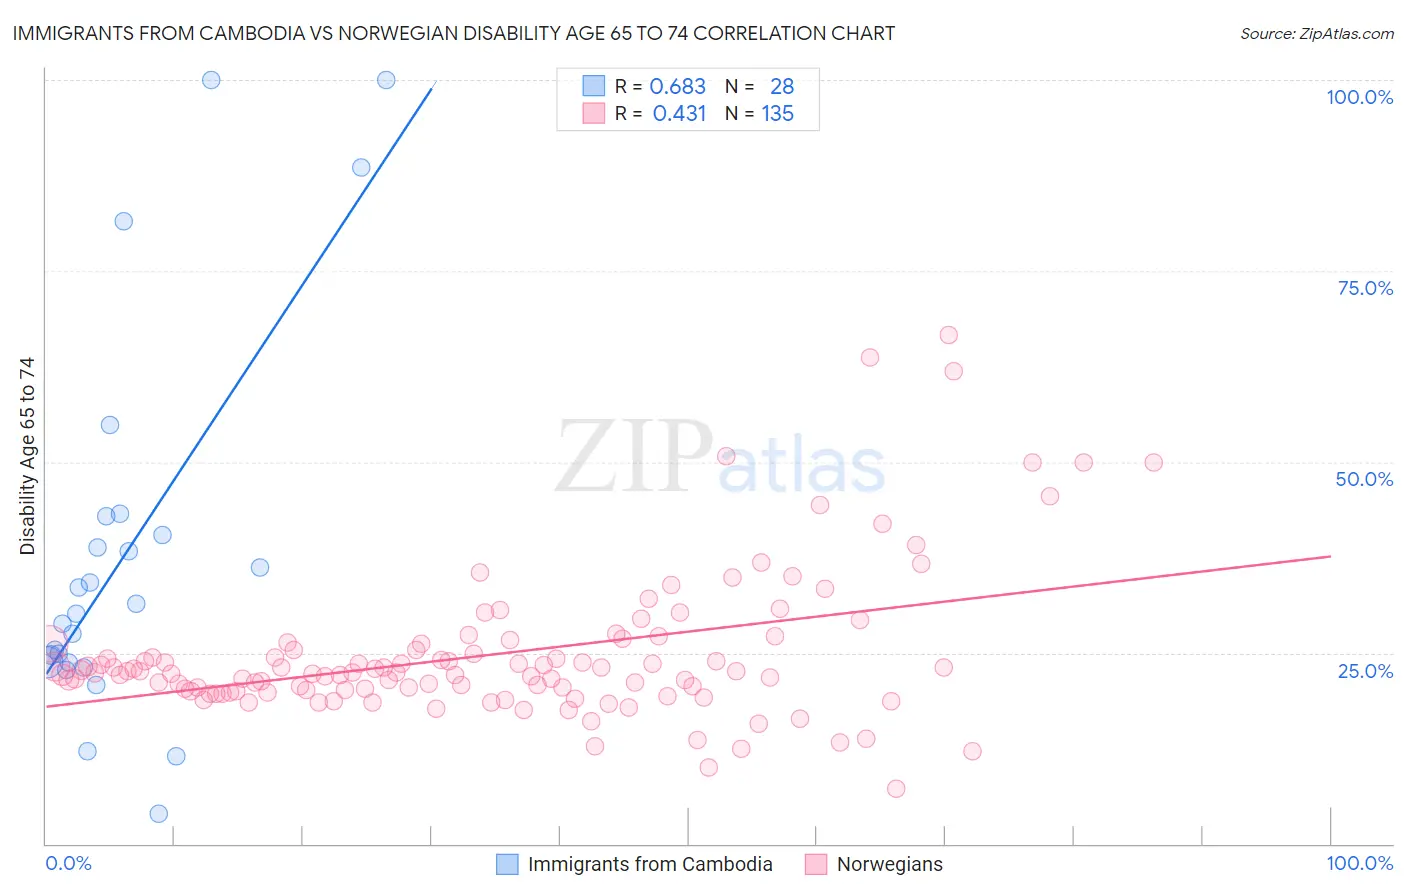
Immigrants from Cambodia vs Norwegian Disability Age 65 to 74 Correlation Chart
The statistical analysis conducted on geographies consisting of 205,056,933 people shows a significant positive correlation between the proportion of Immigrants from Cambodia and percentage of population with a disability between the ages 65 and 75 in the United States with a correlation coefficient (R) of 0.683 and weighted average of 25.3%. Similarly, the statistical analysis conducted on geographies consisting of 531,492,634 people shows a moderate positive correlation between the proportion of Norwegians and percentage of population with a disability between the ages 65 and 75 in the United States with a correlation coefficient (R) of 0.431 and weighted average of 22.5%, a difference of 12.6%.
Disability Age 65 to 74 Correlation Summary
| Measurement | Immigrants from Cambodia | Norwegian |
| Minimum | 4.0% | 7.1% |
| Maximum | 100.0% | 66.7% |
| Range | 96.0% | 59.5% |
| Mean | 38.1% | 24.8% |
| Median | 30.8% | 22.4% |
| Interquartile 25% (IQ1) | 23.8% | 19.9% |
| Interquartile 75% (IQ3) | 41.6% | 26.1% |
| Interquartile Range (IQR) | 17.9% | 6.2% |
| Standard Deviation (Sample) | 25.1% | 9.6% |
| Standard Deviation (Population) | 24.6% | 9.6% |
Similar Demographics by Disability Age 65 to 74
Demographics Similar to Immigrants from Cambodia by Disability Age 65 to 74
In terms of disability age 65 to 74, the demographic groups most similar to Immigrants from Cambodia are Marshallese (25.3%, a difference of 0.090%), Guamanian/Chamorro (25.3%, a difference of 0.15%), Immigrants from Somalia (25.2%, a difference of 0.32%), Malaysian (25.4%, a difference of 0.32%), and Cape Verdean (25.4%, a difference of 0.40%).
| Demographics | Rating | Rank | Disability Age 65 to 74 |
| Immigrants | El Salvador | 0.6 /100 | #252 | Tragic 25.1% |
| Sub-Saharan Africans | 0.6 /100 | #253 | Tragic 25.1% |
| Somalis | 0.6 /100 | #254 | Tragic 25.1% |
| Central Americans | 0.5 /100 | #255 | Tragic 25.1% |
| Immigrants | Somalia | 0.4 /100 | #256 | Tragic 25.2% |
| Guamanians/Chamorros | 0.3 /100 | #257 | Tragic 25.3% |
| Marshallese | 0.3 /100 | #258 | Tragic 25.3% |
| Immigrants | Cambodia | 0.3 /100 | #259 | Tragic 25.3% |
| Malaysians | 0.2 /100 | #260 | Tragic 25.4% |
| Cape Verdeans | 0.2 /100 | #261 | Tragic 25.4% |
| Samoans | 0.2 /100 | #262 | Tragic 25.4% |
| Iroquois | 0.2 /100 | #263 | Tragic 25.4% |
| Hawaiians | 0.2 /100 | #264 | Tragic 25.5% |
| Guatemalans | 0.2 /100 | #265 | Tragic 25.5% |
| Immigrants | Latin America | 0.1 /100 | #266 | Tragic 25.6% |
Demographics Similar to Norwegians by Disability Age 65 to 74
In terms of disability age 65 to 74, the demographic groups most similar to Norwegians are Immigrants from Western Europe (22.5%, a difference of 0.040%), Lebanese (22.5%, a difference of 0.060%), Slovak (22.5%, a difference of 0.17%), Hungarian (22.4%, a difference of 0.19%), and Czech (22.4%, a difference of 0.24%).
| Demographics | Rating | Rank | Disability Age 65 to 74 |
| Swedes | 94.7 /100 | #117 | Exceptional 22.4% |
| Austrians | 94.7 /100 | #118 | Exceptional 22.4% |
| Immigrants | Northern Africa | 94.7 /100 | #119 | Exceptional 22.4% |
| Immigrants | Kazakhstan | 93.9 /100 | #120 | Exceptional 22.4% |
| Czechs | 93.5 /100 | #121 | Exceptional 22.4% |
| Immigrants | Jordan | 93.5 /100 | #122 | Exceptional 22.4% |
| Hungarians | 93.3 /100 | #123 | Exceptional 22.4% |
| Norwegians | 92.5 /100 | #124 | Exceptional 22.5% |
| Immigrants | Western Europe | 92.3 /100 | #125 | Exceptional 22.5% |
| Lebanese | 92.2 /100 | #126 | Exceptional 22.5% |
| Slovaks | 91.6 /100 | #127 | Exceptional 22.5% |
| Immigrants | Costa Rica | 90.4 /100 | #128 | Exceptional 22.6% |
| Immigrants | Uruguay | 90.1 /100 | #129 | Exceptional 22.6% |
| Immigrants | Albania | 90.0 /100 | #130 | Excellent 22.6% |
| Immigrants | Nepal | 89.4 /100 | #131 | Excellent 22.6% |