Asian vs Immigrants from Cuba Disability Age 65 to 74
COMPARE
Asian
Immigrants from Cuba
Disability Age 65 to 74
Disability Age 65 to 74 Comparison
Asians
Immigrants from Cuba
21.4%
DISABILITY AGE 65 TO 74
99.7/ 100
METRIC RATING
45th/ 347
METRIC RANK
23.6%
DISABILITY AGE 65 TO 74
34.0/ 100
METRIC RATING
188th/ 347
METRIC RANK
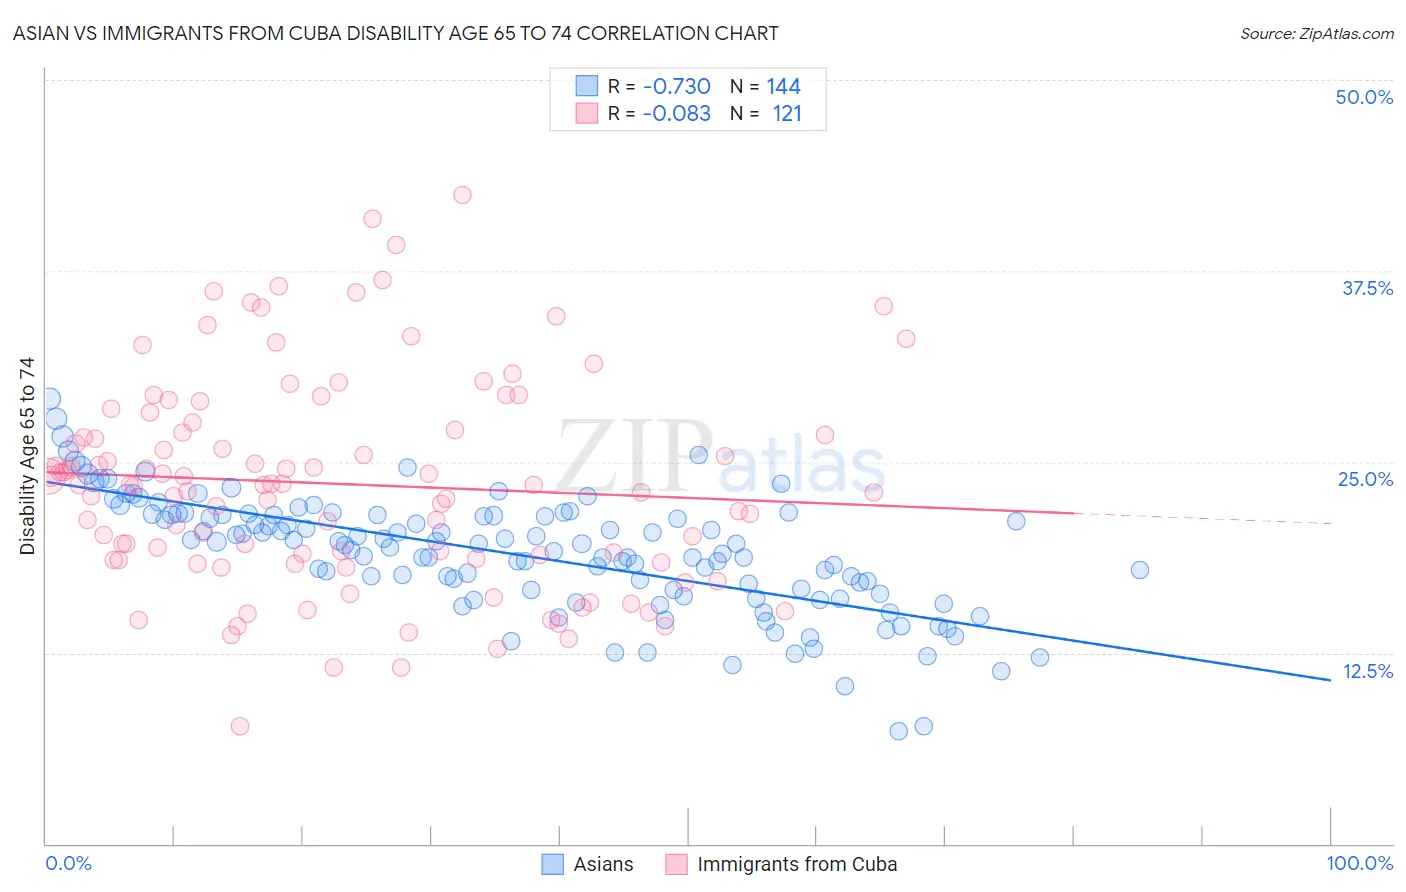
Asian vs Immigrants from Cuba Disability Age 65 to 74 Correlation Chart
The statistical analysis conducted on geographies consisting of 548,760,031 people shows a strong negative correlation between the proportion of Asians and percentage of population with a disability between the ages 65 and 75 in the United States with a correlation coefficient (R) of -0.730 and weighted average of 21.4%. Similarly, the statistical analysis conducted on geographies consisting of 325,637,866 people shows a slight negative correlation between the proportion of Immigrants from Cuba and percentage of population with a disability between the ages 65 and 75 in the United States with a correlation coefficient (R) of -0.083 and weighted average of 23.6%, a difference of 10.3%.
Disability Age 65 to 74 Correlation Summary
| Measurement | Asian | Immigrants from Cuba |
| Minimum | 7.3% | 7.7% |
| Maximum | 29.1% | 42.5% |
| Range | 21.8% | 34.8% |
| Mean | 19.0% | 23.6% |
| Median | 19.6% | 23.5% |
| Interquartile 25% (IQ1) | 16.6% | 18.6% |
| Interquartile 75% (IQ3) | 21.5% | 27.4% |
| Interquartile Range (IQR) | 4.9% | 8.8% |
| Standard Deviation (Sample) | 3.8% | 6.8% |
| Standard Deviation (Population) | 3.8% | 6.8% |
Similar Demographics by Disability Age 65 to 74
Demographics Similar to Asians by Disability Age 65 to 74
In terms of disability age 65 to 74, the demographic groups most similar to Asians are Estonian (21.4%, a difference of 0.020%), Immigrants from Turkey (21.4%, a difference of 0.030%), Immigrants from Bulgaria (21.4%, a difference of 0.030%), Lithuanian (21.4%, a difference of 0.080%), and Luxembourger (21.4%, a difference of 0.080%).
| Demographics | Rating | Rank | Disability Age 65 to 74 |
| Russians | 99.8 /100 | #38 | Exceptional 21.2% |
| Argentineans | 99.8 /100 | #39 | Exceptional 21.2% |
| Latvians | 99.8 /100 | #40 | Exceptional 21.2% |
| Immigrants | Austria | 99.8 /100 | #41 | Exceptional 21.2% |
| Macedonians | 99.7 /100 | #42 | Exceptional 21.3% |
| Immigrants | Croatia | 99.7 /100 | #43 | Exceptional 21.3% |
| Estonians | 99.7 /100 | #44 | Exceptional 21.4% |
| Asians | 99.7 /100 | #45 | Exceptional 21.4% |
| Immigrants | Turkey | 99.7 /100 | #46 | Exceptional 21.4% |
| Immigrants | Bulgaria | 99.7 /100 | #47 | Exceptional 21.4% |
| Lithuanians | 99.7 /100 | #48 | Exceptional 21.4% |
| Luxembourgers | 99.7 /100 | #49 | Exceptional 21.4% |
| Immigrants | Malaysia | 99.7 /100 | #50 | Exceptional 21.4% |
| Immigrants | Serbia | 99.6 /100 | #51 | Exceptional 21.4% |
| Immigrants | France | 99.6 /100 | #52 | Exceptional 21.5% |
Demographics Similar to Immigrants from Cuba by Disability Age 65 to 74
In terms of disability age 65 to 74, the demographic groups most similar to Immigrants from Cuba are Scottish (23.6%, a difference of 0.060%), Immigrants from Guyana (23.6%, a difference of 0.18%), Portuguese (23.5%, a difference of 0.24%), Immigrants from Bangladesh (23.6%, a difference of 0.25%), and Basque (23.5%, a difference of 0.27%).
| Demographics | Rating | Rank | Disability Age 65 to 74 |
| Assyrians/Chaldeans/Syriacs | 45.3 /100 | #181 | Average 23.4% |
| Irish | 44.4 /100 | #182 | Average 23.4% |
| Immigrants | Eastern Africa | 42.8 /100 | #183 | Average 23.4% |
| Immigrants | Germany | 42.5 /100 | #184 | Average 23.4% |
| Haitians | 42.4 /100 | #185 | Average 23.4% |
| Basques | 38.4 /100 | #186 | Fair 23.5% |
| Portuguese | 37.8 /100 | #187 | Fair 23.5% |
| Immigrants | Cuba | 34.0 /100 | #188 | Fair 23.6% |
| Scottish | 33.1 /100 | #189 | Fair 23.6% |
| Immigrants | Guyana | 31.2 /100 | #190 | Fair 23.6% |
| Immigrants | Bangladesh | 30.2 /100 | #191 | Fair 23.6% |
| Ecuadorians | 29.7 /100 | #192 | Fair 23.6% |
| English | 28.5 /100 | #193 | Fair 23.6% |
| Sudanese | 27.8 /100 | #194 | Fair 23.7% |
| Immigrants | St. Vincent and the Grenadines | 26.1 /100 | #195 | Fair 23.7% |