Immigrants from Cambodia vs Cajun Disability Age 65 to 74
COMPARE
Immigrants from Cambodia
Cajun
Disability Age 65 to 74
Disability Age 65 to 74 Comparison
Immigrants from Cambodia
Cajuns
25.3%
DISABILITY AGE 65 TO 74
0.3/ 100
METRIC RATING
259th/ 347
METRIC RANK
27.9%
DISABILITY AGE 65 TO 74
0.0/ 100
METRIC RATING
315th/ 347
METRIC RANK
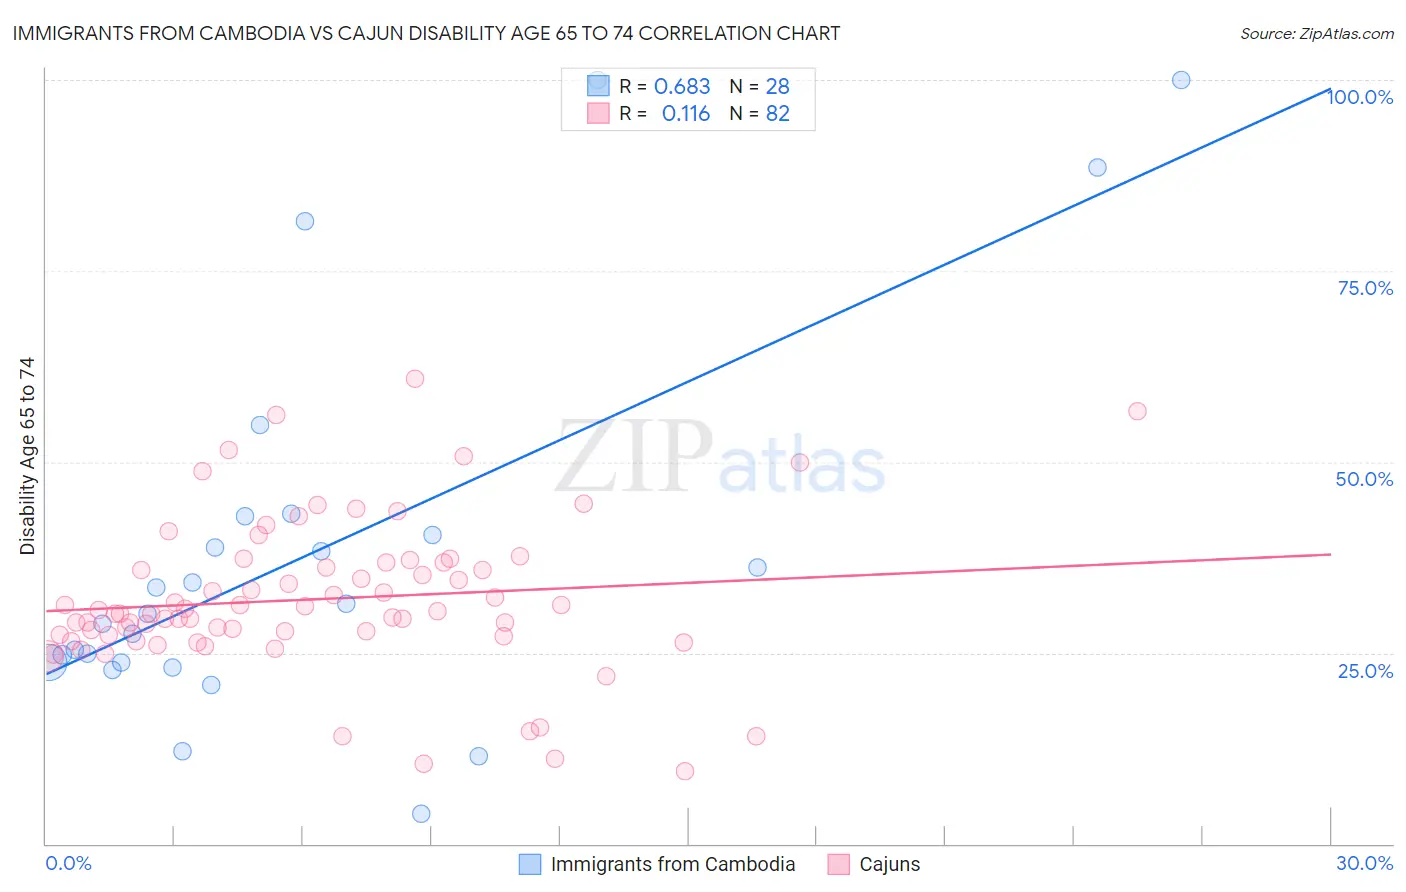
Immigrants from Cambodia vs Cajun Disability Age 65 to 74 Correlation Chart
The statistical analysis conducted on geographies consisting of 205,056,933 people shows a significant positive correlation between the proportion of Immigrants from Cambodia and percentage of population with a disability between the ages 65 and 75 in the United States with a correlation coefficient (R) of 0.683 and weighted average of 25.3%. Similarly, the statistical analysis conducted on geographies consisting of 149,600,778 people shows a poor positive correlation between the proportion of Cajuns and percentage of population with a disability between the ages 65 and 75 in the United States with a correlation coefficient (R) of 0.116 and weighted average of 27.9%, a difference of 10.3%.
Disability Age 65 to 74 Correlation Summary
| Measurement | Immigrants from Cambodia | Cajun |
| Minimum | 4.0% | 9.5% |
| Maximum | 100.0% | 61.0% |
| Range | 96.0% | 51.5% |
| Mean | 38.1% | 32.0% |
| Median | 30.8% | 30.3% |
| Interquartile 25% (IQ1) | 23.8% | 27.3% |
| Interquartile 75% (IQ3) | 41.6% | 36.8% |
| Interquartile Range (IQR) | 17.9% | 9.5% |
| Standard Deviation (Sample) | 25.1% | 9.9% |
| Standard Deviation (Population) | 24.6% | 9.9% |
Similar Demographics by Disability Age 65 to 74
Demographics Similar to Immigrants from Cambodia by Disability Age 65 to 74
In terms of disability age 65 to 74, the demographic groups most similar to Immigrants from Cambodia are Marshallese (25.3%, a difference of 0.090%), Guamanian/Chamorro (25.3%, a difference of 0.15%), Immigrants from Somalia (25.2%, a difference of 0.32%), Malaysian (25.4%, a difference of 0.32%), and Cape Verdean (25.4%, a difference of 0.40%).
| Demographics | Rating | Rank | Disability Age 65 to 74 |
| Immigrants | El Salvador | 0.6 /100 | #252 | Tragic 25.1% |
| Sub-Saharan Africans | 0.6 /100 | #253 | Tragic 25.1% |
| Somalis | 0.6 /100 | #254 | Tragic 25.1% |
| Central Americans | 0.5 /100 | #255 | Tragic 25.1% |
| Immigrants | Somalia | 0.4 /100 | #256 | Tragic 25.2% |
| Guamanians/Chamorros | 0.3 /100 | #257 | Tragic 25.3% |
| Marshallese | 0.3 /100 | #258 | Tragic 25.3% |
| Immigrants | Cambodia | 0.3 /100 | #259 | Tragic 25.3% |
| Malaysians | 0.2 /100 | #260 | Tragic 25.4% |
| Cape Verdeans | 0.2 /100 | #261 | Tragic 25.4% |
| Samoans | 0.2 /100 | #262 | Tragic 25.4% |
| Iroquois | 0.2 /100 | #263 | Tragic 25.4% |
| Hawaiians | 0.2 /100 | #264 | Tragic 25.5% |
| Guatemalans | 0.2 /100 | #265 | Tragic 25.5% |
| Immigrants | Latin America | 0.1 /100 | #266 | Tragic 25.6% |
Demographics Similar to Cajuns by Disability Age 65 to 74
In terms of disability age 65 to 74, the demographic groups most similar to Cajuns are Crow (27.9%, a difference of 0.040%), Immigrants from Armenia (28.0%, a difference of 0.13%), Nepalese (28.0%, a difference of 0.35%), Chippewa (27.8%, a difference of 0.47%), and Paiute (27.8%, a difference of 0.48%).
| Demographics | Rating | Rank | Disability Age 65 to 74 |
| Sioux | 0.0 /100 | #308 | Tragic 27.3% |
| Yaqui | 0.0 /100 | #309 | Tragic 27.4% |
| Shoshone | 0.0 /100 | #310 | Tragic 27.4% |
| Menominee | 0.0 /100 | #311 | Tragic 27.4% |
| Osage | 0.0 /100 | #312 | Tragic 27.5% |
| Paiute | 0.0 /100 | #313 | Tragic 27.8% |
| Chippewa | 0.0 /100 | #314 | Tragic 27.8% |
| Cajuns | 0.0 /100 | #315 | Tragic 27.9% |
| Crow | 0.0 /100 | #316 | Tragic 27.9% |
| Immigrants | Armenia | 0.0 /100 | #317 | Tragic 28.0% |
| Nepalese | 0.0 /100 | #318 | Tragic 28.0% |
| Arapaho | 0.0 /100 | #319 | Tragic 28.1% |
| Cherokee | 0.0 /100 | #320 | Tragic 28.2% |
| Comanche | 0.0 /100 | #321 | Tragic 28.3% |
| Aleuts | 0.0 /100 | #322 | Tragic 28.4% |