Immigrants from Cabo Verde vs French American Indian Male Disability
COMPARE
Immigrants from Cabo Verde
French American Indian
Male Disability
Male Disability Comparison
Immigrants from Cabo Verde
French American Indians
12.8%
MALE DISABILITY
0.0/ 100
METRIC RATING
289th/ 347
METRIC RANK
13.4%
MALE DISABILITY
0.0/ 100
METRIC RATING
308th/ 347
METRIC RANK
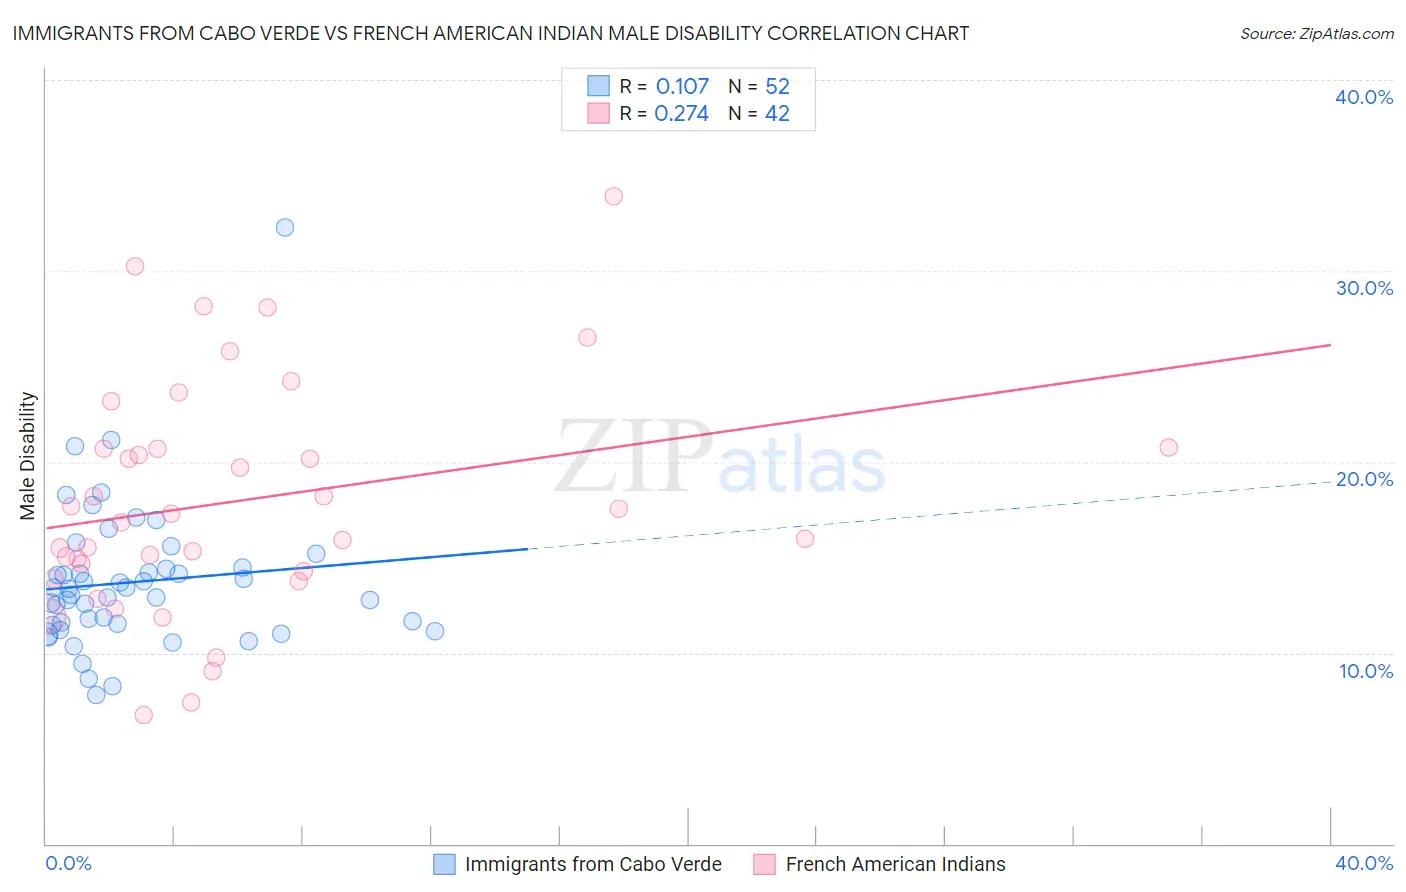
Immigrants from Cabo Verde vs French American Indian Male Disability Correlation Chart
The statistical analysis conducted on geographies consisting of 38,149,674 people shows a poor positive correlation between the proportion of Immigrants from Cabo Verde and percentage of males with a disability in the United States with a correlation coefficient (R) of 0.107 and weighted average of 12.8%. Similarly, the statistical analysis conducted on geographies consisting of 131,973,508 people shows a weak positive correlation between the proportion of French American Indians and percentage of males with a disability in the United States with a correlation coefficient (R) of 0.274 and weighted average of 13.4%, a difference of 4.3%.
Male Disability Correlation Summary
| Measurement | Immigrants from Cabo Verde | French American Indian |
| Minimum | 7.8% | 6.8% |
| Maximum | 32.3% | 33.9% |
| Range | 24.5% | 27.2% |
| Mean | 13.7% | 17.9% |
| Median | 13.2% | 17.0% |
| Interquartile 25% (IQ1) | 11.5% | 14.3% |
| Interquartile 75% (IQ3) | 14.4% | 20.7% |
| Interquartile Range (IQR) | 3.0% | 6.4% |
| Standard Deviation (Sample) | 3.9% | 6.1% |
| Standard Deviation (Population) | 3.8% | 6.0% |
Demographics Similar to Immigrants from Cabo Verde and French American Indians by Male Disability
In terms of male disability, the demographic groups most similar to Immigrants from Cabo Verde are Pima (12.8%, a difference of 0.15%), Yup'ik (12.8%, a difference of 0.19%), White/Caucasian (12.8%, a difference of 0.24%), English (12.8%, a difference of 0.30%), and Yaqui (12.9%, a difference of 0.59%). Similarly, the demographic groups most similar to French American Indians are Arapaho (13.3%, a difference of 0.15%), Spanish American (13.3%, a difference of 0.38%), French Canadian (13.3%, a difference of 0.58%), Black/African American (13.2%, a difference of 0.99%), and Scotch-Irish (13.2%, a difference of 1.3%).
| Demographics | Rating | Rank | Male Disability |
| Yup'ik | 0.0 /100 | #288 | Tragic 12.8% |
| Immigrants | Cabo Verde | 0.0 /100 | #289 | Tragic 12.8% |
| Pima | 0.0 /100 | #290 | Tragic 12.8% |
| Whites/Caucasians | 0.0 /100 | #291 | Tragic 12.8% |
| English | 0.0 /100 | #292 | Tragic 12.8% |
| Yaqui | 0.0 /100 | #293 | Tragic 12.9% |
| Marshallese | 0.0 /100 | #294 | Tragic 12.9% |
| Immigrants | Micronesia | 0.0 /100 | #295 | Tragic 12.9% |
| Immigrants | Nonimmigrants | 0.0 /100 | #296 | Tragic 12.9% |
| Inupiat | 0.0 /100 | #297 | Tragic 13.0% |
| Pennsylvania Germans | 0.0 /100 | #298 | Tragic 13.0% |
| Celtics | 0.0 /100 | #299 | Tragic 13.0% |
| Cheyenne | 0.0 /100 | #300 | Tragic 13.0% |
| French | 0.0 /100 | #301 | Tragic 13.0% |
| Crow | 0.0 /100 | #302 | Tragic 13.1% |
| Scotch-Irish | 0.0 /100 | #303 | Tragic 13.2% |
| Blacks/African Americans | 0.0 /100 | #304 | Tragic 13.2% |
| French Canadians | 0.0 /100 | #305 | Tragic 13.3% |
| Spanish Americans | 0.0 /100 | #306 | Tragic 13.3% |
| Arapaho | 0.0 /100 | #307 | Tragic 13.3% |
| French American Indians | 0.0 /100 | #308 | Tragic 13.4% |