Malaysian vs British Male Disability
COMPARE
Malaysian
British
Male Disability
Male Disability Comparison
Malaysians
British
11.8%
MALE DISABILITY
1.8/ 100
METRIC RATING
232nd/ 347
METRIC RANK
12.1%
MALE DISABILITY
0.4/ 100
METRIC RATING
254th/ 347
METRIC RANK
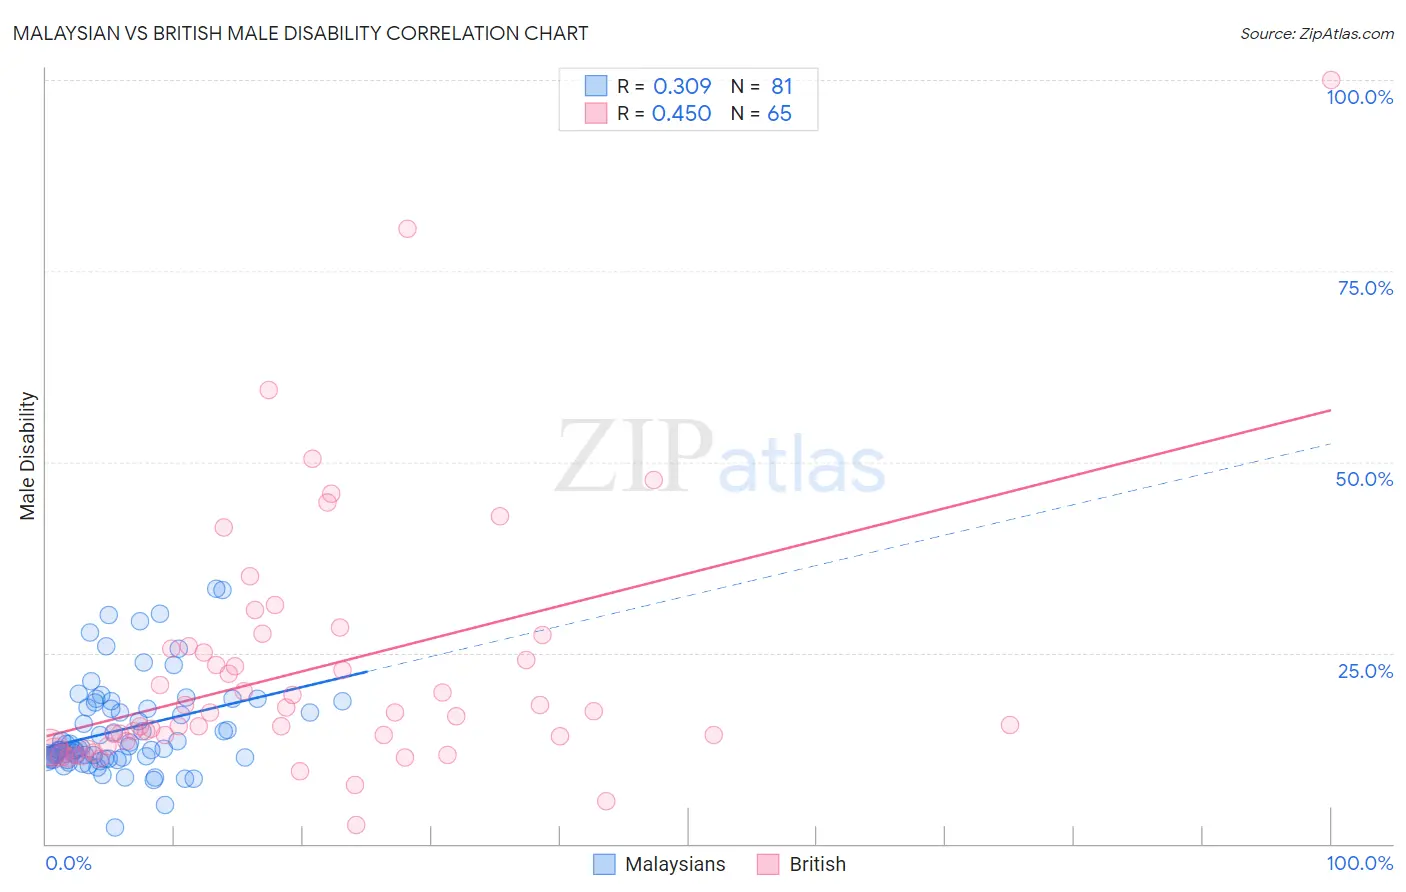
Malaysian vs British Male Disability Correlation Chart
The statistical analysis conducted on geographies consisting of 226,062,465 people shows a mild positive correlation between the proportion of Malaysians and percentage of males with a disability in the United States with a correlation coefficient (R) of 0.309 and weighted average of 11.8%. Similarly, the statistical analysis conducted on geographies consisting of 531,329,993 people shows a moderate positive correlation between the proportion of British and percentage of males with a disability in the United States with a correlation coefficient (R) of 0.450 and weighted average of 12.1%, a difference of 1.9%.
Male Disability Correlation Summary
| Measurement | Malaysian | British |
| Minimum | 2.1% | 2.5% |
| Maximum | 33.3% | 100.0% |
| Range | 31.3% | 97.5% |
| Mean | 15.0% | 22.7% |
| Median | 12.5% | 17.1% |
| Interquartile 25% (IQ1) | 11.2% | 13.2% |
| Interquartile 75% (IQ3) | 18.2% | 25.7% |
| Interquartile Range (IQR) | 6.9% | 12.5% |
| Standard Deviation (Sample) | 6.2% | 16.7% |
| Standard Deviation (Population) | 6.1% | 16.6% |
Similar Demographics by Male Disability
Demographics Similar to Malaysians by Male Disability
In terms of male disability, the demographic groups most similar to Malaysians are Mexican (11.8%, a difference of 0.040%), Dominican (11.8%, a difference of 0.060%), Immigrants from Canada (11.9%, a difference of 0.11%), Immigrants from North America (11.9%, a difference of 0.24%), and Croatian (11.8%, a difference of 0.26%).
| Demographics | Rating | Rank | Male Disability |
| Liberians | 3.1 /100 | #225 | Tragic 11.8% |
| Sub-Saharan Africans | 2.8 /100 | #226 | Tragic 11.8% |
| Austrians | 2.5 /100 | #227 | Tragic 11.8% |
| Hispanics or Latinos | 2.3 /100 | #228 | Tragic 11.8% |
| Bermudans | 2.3 /100 | #229 | Tragic 11.8% |
| Croatians | 2.1 /100 | #230 | Tragic 11.8% |
| Dominicans | 1.8 /100 | #231 | Tragic 11.8% |
| Malaysians | 1.8 /100 | #232 | Tragic 11.8% |
| Mexicans | 1.7 /100 | #233 | Tragic 11.8% |
| Immigrants | Canada | 1.6 /100 | #234 | Tragic 11.9% |
| Immigrants | North America | 1.5 /100 | #235 | Tragic 11.9% |
| U.S. Virgin Islanders | 1.3 /100 | #236 | Tragic 11.9% |
| Carpatho Rusyns | 1.3 /100 | #237 | Tragic 11.9% |
| Yugoslavians | 1.2 /100 | #238 | Tragic 11.9% |
| Italians | 1.2 /100 | #239 | Tragic 11.9% |
Demographics Similar to British by Male Disability
In terms of male disability, the demographic groups most similar to British are Chinese (12.1%, a difference of 0.010%), Guamanian/Chamorro (12.0%, a difference of 0.18%), Slovene (12.0%, a difference of 0.19%), German Russian (12.0%, a difference of 0.26%), and Swiss (12.1%, a difference of 0.26%).
| Demographics | Rating | Rank | Male Disability |
| Hungarians | 0.8 /100 | #247 | Tragic 12.0% |
| Poles | 0.7 /100 | #248 | Tragic 12.0% |
| Immigrants | Yemen | 0.5 /100 | #249 | Tragic 12.0% |
| Bangladeshis | 0.5 /100 | #250 | Tragic 12.0% |
| German Russians | 0.5 /100 | #251 | Tragic 12.0% |
| Slovenes | 0.5 /100 | #252 | Tragic 12.0% |
| Guamanians/Chamorros | 0.5 /100 | #253 | Tragic 12.0% |
| British | 0.4 /100 | #254 | Tragic 12.1% |
| Chinese | 0.4 /100 | #255 | Tragic 12.1% |
| Swiss | 0.3 /100 | #256 | Tragic 12.1% |
| Europeans | 0.3 /100 | #257 | Tragic 12.1% |
| Basques | 0.3 /100 | #258 | Tragic 12.1% |
| Belgians | 0.3 /100 | #259 | Tragic 12.1% |
| Swedes | 0.3 /100 | #260 | Tragic 12.1% |
| Slavs | 0.2 /100 | #261 | Tragic 12.2% |