Immigrants from Burma/Myanmar vs Swedish Female Disability
COMPARE
Immigrants from Burma/Myanmar
Swedish
Female Disability
Female Disability Comparison
Immigrants from Burma/Myanmar
Swedes
12.4%
FEMALE DISABILITY
13.3/ 100
METRIC RATING
216th/ 347
METRIC RANK
12.3%
FEMALE DISABILITY
26.6/ 100
METRIC RATING
195th/ 347
METRIC RANK
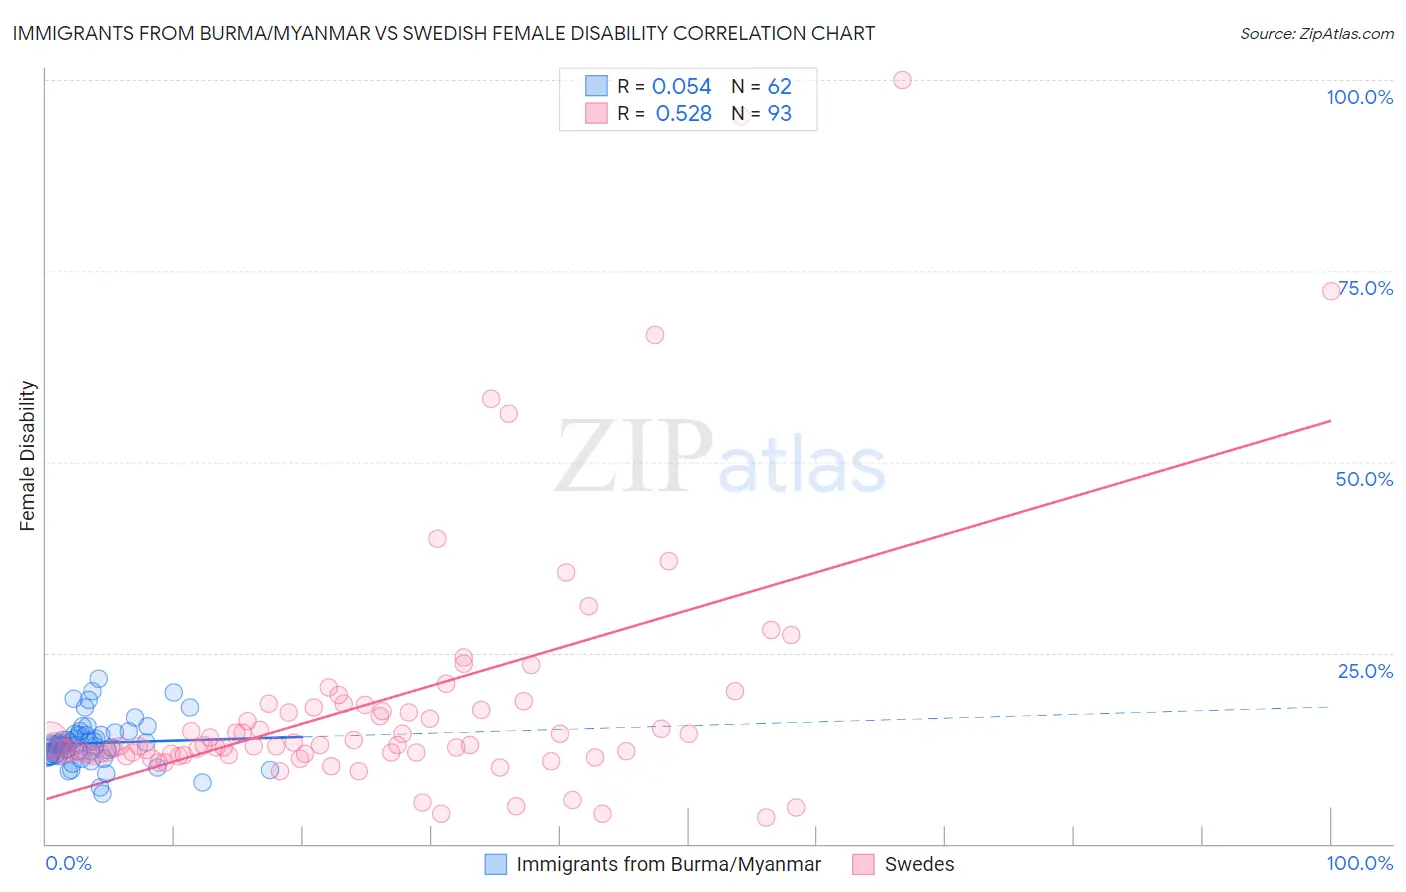
Immigrants from Burma/Myanmar vs Swedish Female Disability Correlation Chart
The statistical analysis conducted on geographies consisting of 172,344,349 people shows a slight positive correlation between the proportion of Immigrants from Burma/Myanmar and percentage of females with a disability in the United States with a correlation coefficient (R) of 0.054 and weighted average of 12.4%. Similarly, the statistical analysis conducted on geographies consisting of 539,030,282 people shows a substantial positive correlation between the proportion of Swedes and percentage of females with a disability in the United States with a correlation coefficient (R) of 0.528 and weighted average of 12.3%, a difference of 0.80%.
Female Disability Correlation Summary
| Measurement | Immigrants from Burma/Myanmar | Swedish |
| Minimum | 6.6% | 3.5% |
| Maximum | 21.6% | 100.0% |
| Range | 15.0% | 96.5% |
| Mean | 13.2% | 18.5% |
| Median | 12.9% | 12.9% |
| Interquartile 25% (IQ1) | 11.6% | 11.7% |
| Interquartile 75% (IQ3) | 14.3% | 18.0% |
| Interquartile Range (IQR) | 2.7% | 6.3% |
| Standard Deviation (Sample) | 2.9% | 16.8% |
| Standard Deviation (Population) | 2.9% | 16.7% |
Similar Demographics by Female Disability
Demographics Similar to Immigrants from Burma/Myanmar by Female Disability
In terms of female disability, the demographic groups most similar to Immigrants from Burma/Myanmar are Panamanian (12.4%, a difference of 0.010%), Samoan (12.4%, a difference of 0.010%), British (12.4%, a difference of 0.050%), Immigrants from Bahamas (12.4%, a difference of 0.070%), and Immigrants from Thailand (12.4%, a difference of 0.090%).
| Demographics | Rating | Rank | Female Disability |
| Mexicans | 15.7 /100 | #209 | Poor 12.4% |
| Swiss | 14.9 /100 | #210 | Poor 12.4% |
| Immigrants | Bosnia and Herzegovina | 14.8 /100 | #211 | Poor 12.4% |
| Ute | 14.7 /100 | #212 | Poor 12.4% |
| Immigrants | Thailand | 14.5 /100 | #213 | Poor 12.4% |
| Panamanians | 13.5 /100 | #214 | Poor 12.4% |
| Samoans | 13.4 /100 | #215 | Poor 12.4% |
| Immigrants | Burma/Myanmar | 13.3 /100 | #216 | Poor 12.4% |
| British | 12.7 /100 | #217 | Poor 12.4% |
| Immigrants | Bahamas | 12.5 /100 | #218 | Poor 12.4% |
| Europeans | 12.1 /100 | #219 | Poor 12.4% |
| Bahamians | 11.1 /100 | #220 | Poor 12.4% |
| Native Hawaiians | 10.8 /100 | #221 | Poor 12.4% |
| Italians | 10.7 /100 | #222 | Poor 12.4% |
| Guamanians/Chamorros | 9.5 /100 | #223 | Tragic 12.5% |
Demographics Similar to Swedes by Female Disability
In terms of female disability, the demographic groups most similar to Swedes are Ukrainian (12.3%, a difference of 0.030%), Northern European (12.3%, a difference of 0.040%), Immigrants from Panama (12.3%, a difference of 0.060%), Honduran (12.3%, a difference of 0.060%), and Mexican American Indian (12.3%, a difference of 0.080%).
| Demographics | Rating | Rank | Female Disability |
| Immigrants | North America | 32.8 /100 | #188 | Fair 12.3% |
| Immigrants | Albania | 31.6 /100 | #189 | Fair 12.3% |
| Immigrants | Honduras | 31.3 /100 | #190 | Fair 12.3% |
| Armenians | 29.7 /100 | #191 | Fair 12.3% |
| Immigrants | Western Africa | 29.2 /100 | #192 | Fair 12.3% |
| Northern Europeans | 27.5 /100 | #193 | Fair 12.3% |
| Ukrainians | 27.2 /100 | #194 | Fair 12.3% |
| Swedes | 26.6 /100 | #195 | Fair 12.3% |
| Immigrants | Panama | 25.5 /100 | #196 | Fair 12.3% |
| Hondurans | 25.4 /100 | #197 | Fair 12.3% |
| Mexican American Indians | 24.9 /100 | #198 | Fair 12.3% |
| Immigrants | Trinidad and Tobago | 24.7 /100 | #199 | Fair 12.3% |
| Trinidadians and Tobagonians | 22.4 /100 | #200 | Fair 12.3% |
| Chinese | 22.1 /100 | #201 | Fair 12.3% |
| Somalis | 21.5 /100 | #202 | Fair 12.3% |