Cherokee vs Swedish Female Disability
COMPARE
Cherokee
Swedish
Female Disability
Female Disability Comparison
Cherokee
Swedes
14.9%
FEMALE DISABILITY
0.0/ 100
METRIC RATING
334th/ 347
METRIC RANK
12.3%
FEMALE DISABILITY
26.6/ 100
METRIC RATING
195th/ 347
METRIC RANK
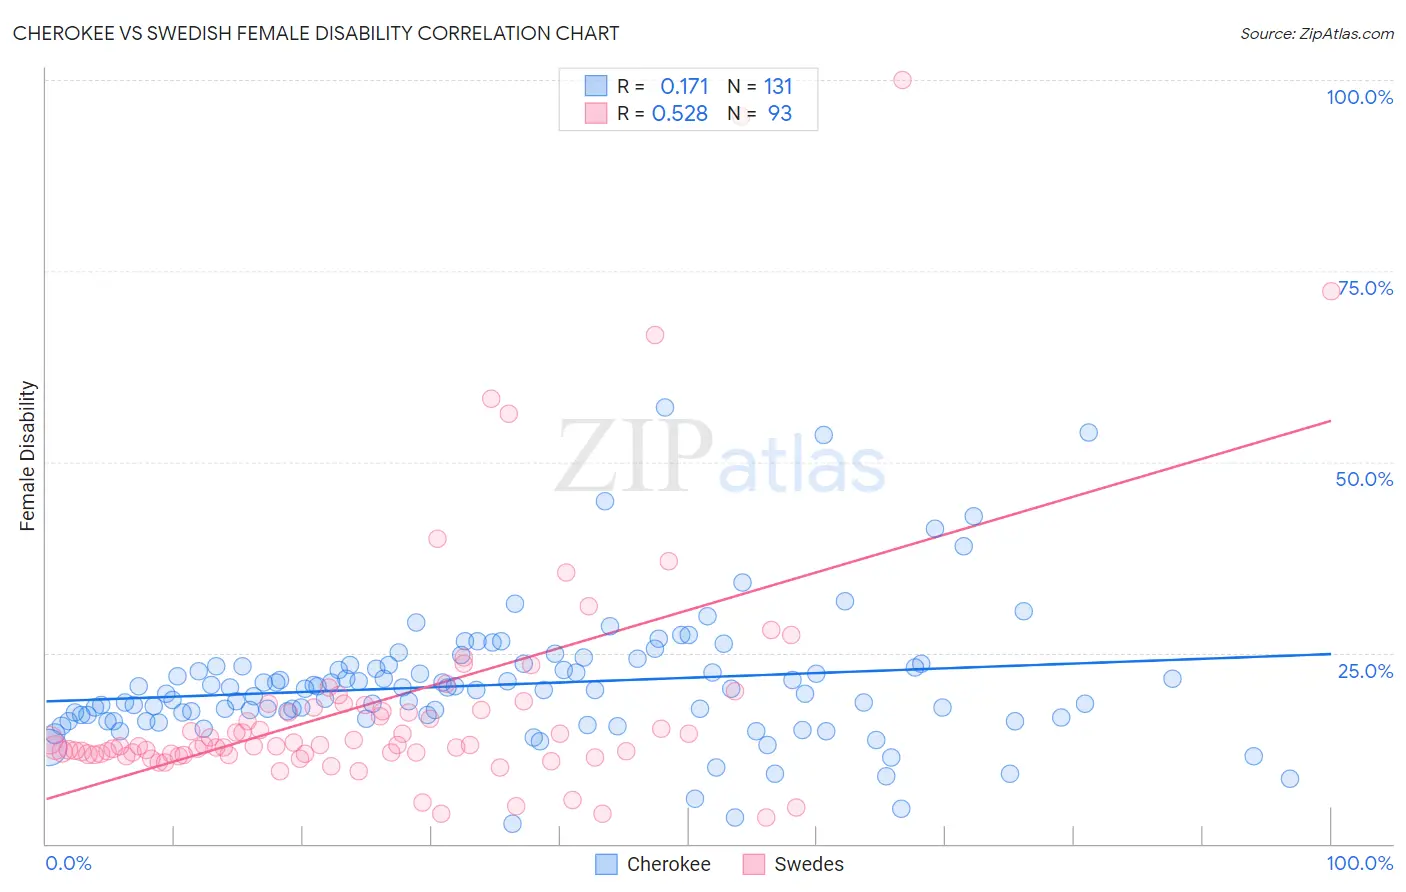
Cherokee vs Swedish Female Disability Correlation Chart
The statistical analysis conducted on geographies consisting of 493,548,902 people shows a poor positive correlation between the proportion of Cherokee and percentage of females with a disability in the United States with a correlation coefficient (R) of 0.171 and weighted average of 14.9%. Similarly, the statistical analysis conducted on geographies consisting of 539,030,282 people shows a substantial positive correlation between the proportion of Swedes and percentage of females with a disability in the United States with a correlation coefficient (R) of 0.528 and weighted average of 12.3%, a difference of 20.7%.
Female Disability Correlation Summary
| Measurement | Cherokee | Swedish |
| Minimum | 2.6% | 3.5% |
| Maximum | 57.1% | 100.0% |
| Range | 54.6% | 96.5% |
| Mean | 20.9% | 18.5% |
| Median | 20.2% | 12.9% |
| Interquartile 25% (IQ1) | 16.5% | 11.7% |
| Interquartile 75% (IQ3) | 23.3% | 18.0% |
| Interquartile Range (IQR) | 6.8% | 6.3% |
| Standard Deviation (Sample) | 8.5% | 16.8% |
| Standard Deviation (Population) | 8.5% | 16.7% |
Similar Demographics by Female Disability
Demographics Similar to Cherokee by Female Disability
In terms of female disability, the demographic groups most similar to Cherokee are Cajun (14.9%, a difference of 0.020%), Immigrants from the Azores (14.9%, a difference of 0.090%), Pima (14.8%, a difference of 0.48%), Seminole (15.0%, a difference of 0.69%), and Tohono O'odham (15.0%, a difference of 0.82%).
| Demographics | Rating | Rank | Female Disability |
| Ottawa | 0.0 /100 | #327 | Tragic 14.2% |
| Cape Verdeans | 0.0 /100 | #328 | Tragic 14.2% |
| Osage | 0.0 /100 | #329 | Tragic 14.3% |
| Yuman | 0.0 /100 | #330 | Tragic 14.5% |
| Immigrants | Cabo Verde | 0.0 /100 | #331 | Tragic 14.6% |
| Pima | 0.0 /100 | #332 | Tragic 14.8% |
| Immigrants | Azores | 0.0 /100 | #333 | Tragic 14.9% |
| Cherokee | 0.0 /100 | #334 | Tragic 14.9% |
| Cajuns | 0.0 /100 | #335 | Tragic 14.9% |
| Seminole | 0.0 /100 | #336 | Tragic 15.0% |
| Tohono O'odham | 0.0 /100 | #337 | Tragic 15.0% |
| Dutch West Indians | 0.0 /100 | #338 | Tragic 15.0% |
| Colville | 0.0 /100 | #339 | Tragic 15.1% |
| Chickasaw | 0.0 /100 | #340 | Tragic 15.2% |
| Choctaw | 0.0 /100 | #341 | Tragic 15.4% |
Demographics Similar to Swedes by Female Disability
In terms of female disability, the demographic groups most similar to Swedes are Ukrainian (12.3%, a difference of 0.030%), Northern European (12.3%, a difference of 0.040%), Immigrants from Panama (12.3%, a difference of 0.060%), Honduran (12.3%, a difference of 0.060%), and Mexican American Indian (12.3%, a difference of 0.080%).
| Demographics | Rating | Rank | Female Disability |
| Immigrants | North America | 32.8 /100 | #188 | Fair 12.3% |
| Immigrants | Albania | 31.6 /100 | #189 | Fair 12.3% |
| Immigrants | Honduras | 31.3 /100 | #190 | Fair 12.3% |
| Armenians | 29.7 /100 | #191 | Fair 12.3% |
| Immigrants | Western Africa | 29.2 /100 | #192 | Fair 12.3% |
| Northern Europeans | 27.5 /100 | #193 | Fair 12.3% |
| Ukrainians | 27.2 /100 | #194 | Fair 12.3% |
| Swedes | 26.6 /100 | #195 | Fair 12.3% |
| Immigrants | Panama | 25.5 /100 | #196 | Fair 12.3% |
| Hondurans | 25.4 /100 | #197 | Fair 12.3% |
| Mexican American Indians | 24.9 /100 | #198 | Fair 12.3% |
| Immigrants | Trinidad and Tobago | 24.7 /100 | #199 | Fair 12.3% |
| Trinidadians and Tobagonians | 22.4 /100 | #200 | Fair 12.3% |
| Chinese | 22.1 /100 | #201 | Fair 12.3% |
| Somalis | 21.5 /100 | #202 | Fair 12.3% |