Immigrants from Burma/Myanmar vs Yugoslavian Female Disability
COMPARE
Immigrants from Burma/Myanmar
Yugoslavian
Female Disability
Female Disability Comparison
Immigrants from Burma/Myanmar
Yugoslavians
12.4%
FEMALE DISABILITY
13.3/ 100
METRIC RATING
216th/ 347
METRIC RANK
12.6%
FEMALE DISABILITY
3.7/ 100
METRIC RATING
238th/ 347
METRIC RANK
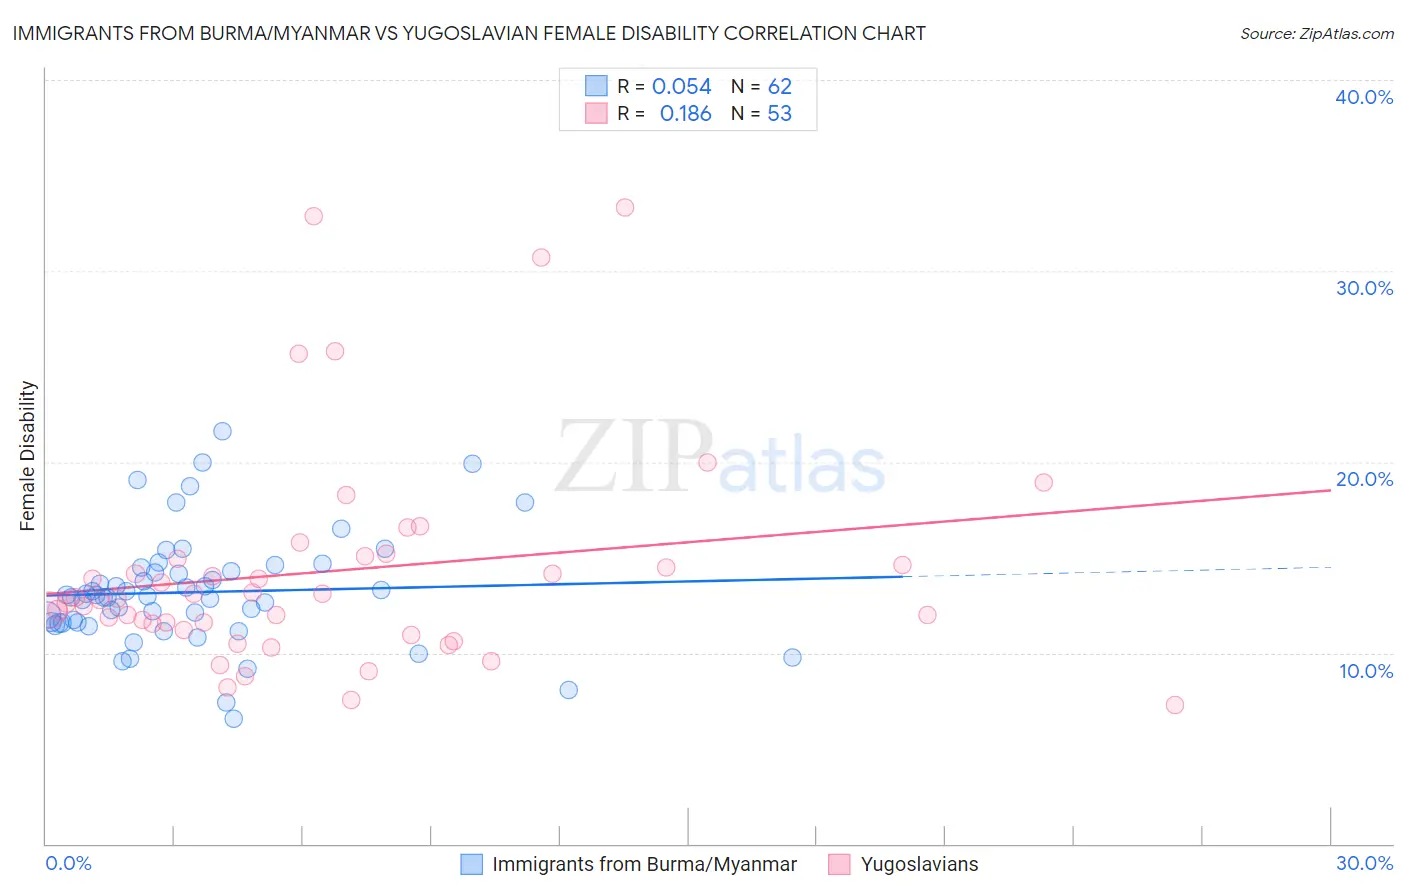
Immigrants from Burma/Myanmar vs Yugoslavian Female Disability Correlation Chart
The statistical analysis conducted on geographies consisting of 172,344,349 people shows a slight positive correlation between the proportion of Immigrants from Burma/Myanmar and percentage of females with a disability in the United States with a correlation coefficient (R) of 0.054 and weighted average of 12.4%. Similarly, the statistical analysis conducted on geographies consisting of 285,691,291 people shows a poor positive correlation between the proportion of Yugoslavians and percentage of females with a disability in the United States with a correlation coefficient (R) of 0.186 and weighted average of 12.6%, a difference of 1.3%.
Female Disability Correlation Summary
| Measurement | Immigrants from Burma/Myanmar | Yugoslavian |
| Minimum | 6.6% | 7.3% |
| Maximum | 21.6% | 33.3% |
| Range | 15.0% | 26.1% |
| Mean | 13.2% | 14.3% |
| Median | 12.9% | 12.9% |
| Interquartile 25% (IQ1) | 11.6% | 11.4% |
| Interquartile 75% (IQ3) | 14.3% | 15.0% |
| Interquartile Range (IQR) | 2.7% | 3.6% |
| Standard Deviation (Sample) | 2.9% | 5.7% |
| Standard Deviation (Population) | 2.9% | 5.7% |
Similar Demographics by Female Disability
Demographics Similar to Immigrants from Burma/Myanmar by Female Disability
In terms of female disability, the demographic groups most similar to Immigrants from Burma/Myanmar are Panamanian (12.4%, a difference of 0.010%), Samoan (12.4%, a difference of 0.010%), British (12.4%, a difference of 0.050%), Immigrants from Bahamas (12.4%, a difference of 0.070%), and Immigrants from Thailand (12.4%, a difference of 0.090%).
| Demographics | Rating | Rank | Female Disability |
| Mexicans | 15.7 /100 | #209 | Poor 12.4% |
| Swiss | 14.9 /100 | #210 | Poor 12.4% |
| Immigrants | Bosnia and Herzegovina | 14.8 /100 | #211 | Poor 12.4% |
| Ute | 14.7 /100 | #212 | Poor 12.4% |
| Immigrants | Thailand | 14.5 /100 | #213 | Poor 12.4% |
| Panamanians | 13.5 /100 | #214 | Poor 12.4% |
| Samoans | 13.4 /100 | #215 | Poor 12.4% |
| Immigrants | Burma/Myanmar | 13.3 /100 | #216 | Poor 12.4% |
| British | 12.7 /100 | #217 | Poor 12.4% |
| Immigrants | Bahamas | 12.5 /100 | #218 | Poor 12.4% |
| Europeans | 12.1 /100 | #219 | Poor 12.4% |
| Bahamians | 11.1 /100 | #220 | Poor 12.4% |
| Native Hawaiians | 10.8 /100 | #221 | Poor 12.4% |
| Italians | 10.7 /100 | #222 | Poor 12.4% |
| Guamanians/Chamorros | 9.5 /100 | #223 | Tragic 12.5% |
Demographics Similar to Yugoslavians by Female Disability
In terms of female disability, the demographic groups most similar to Yugoslavians are Slavic (12.6%, a difference of 0.030%), Barbadian (12.6%, a difference of 0.030%), German Russian (12.6%, a difference of 0.13%), Immigrants from West Indies (12.6%, a difference of 0.15%), and Malaysian (12.5%, a difference of 0.28%).
| Demographics | Rating | Rank | Female Disability |
| Belgians | 6.5 /100 | #231 | Tragic 12.5% |
| Immigrants | Somalia | 5.9 /100 | #232 | Tragic 12.5% |
| Immigrants | Iraq | 5.3 /100 | #233 | Tragic 12.5% |
| Scandinavians | 5.3 /100 | #234 | Tragic 12.5% |
| Malaysians | 5.0 /100 | #235 | Tragic 12.5% |
| Immigrants | West Indies | 4.4 /100 | #236 | Tragic 12.6% |
| Slavs | 3.8 /100 | #237 | Tragic 12.6% |
| Yugoslavians | 3.7 /100 | #238 | Tragic 12.6% |
| Barbadians | 3.6 /100 | #239 | Tragic 12.6% |
| German Russians | 3.2 /100 | #240 | Tragic 12.6% |
| Japanese | 2.7 /100 | #241 | Tragic 12.6% |
| Canadians | 2.6 /100 | #242 | Tragic 12.6% |
| Immigrants | Senegal | 2.5 /100 | #243 | Tragic 12.6% |
| Alsatians | 2.5 /100 | #244 | Tragic 12.6% |
| Immigrants | Jamaica | 2.2 /100 | #245 | Tragic 12.6% |