Immigrants from Burma/Myanmar vs Peruvian Female Disability
COMPARE
Immigrants from Burma/Myanmar
Peruvian
Female Disability
Female Disability Comparison
Immigrants from Burma/Myanmar
Peruvians
12.4%
FEMALE DISABILITY
13.3/ 100
METRIC RATING
216th/ 347
METRIC RANK
11.3%
FEMALE DISABILITY
99.9/ 100
METRIC RATING
54th/ 347
METRIC RANK
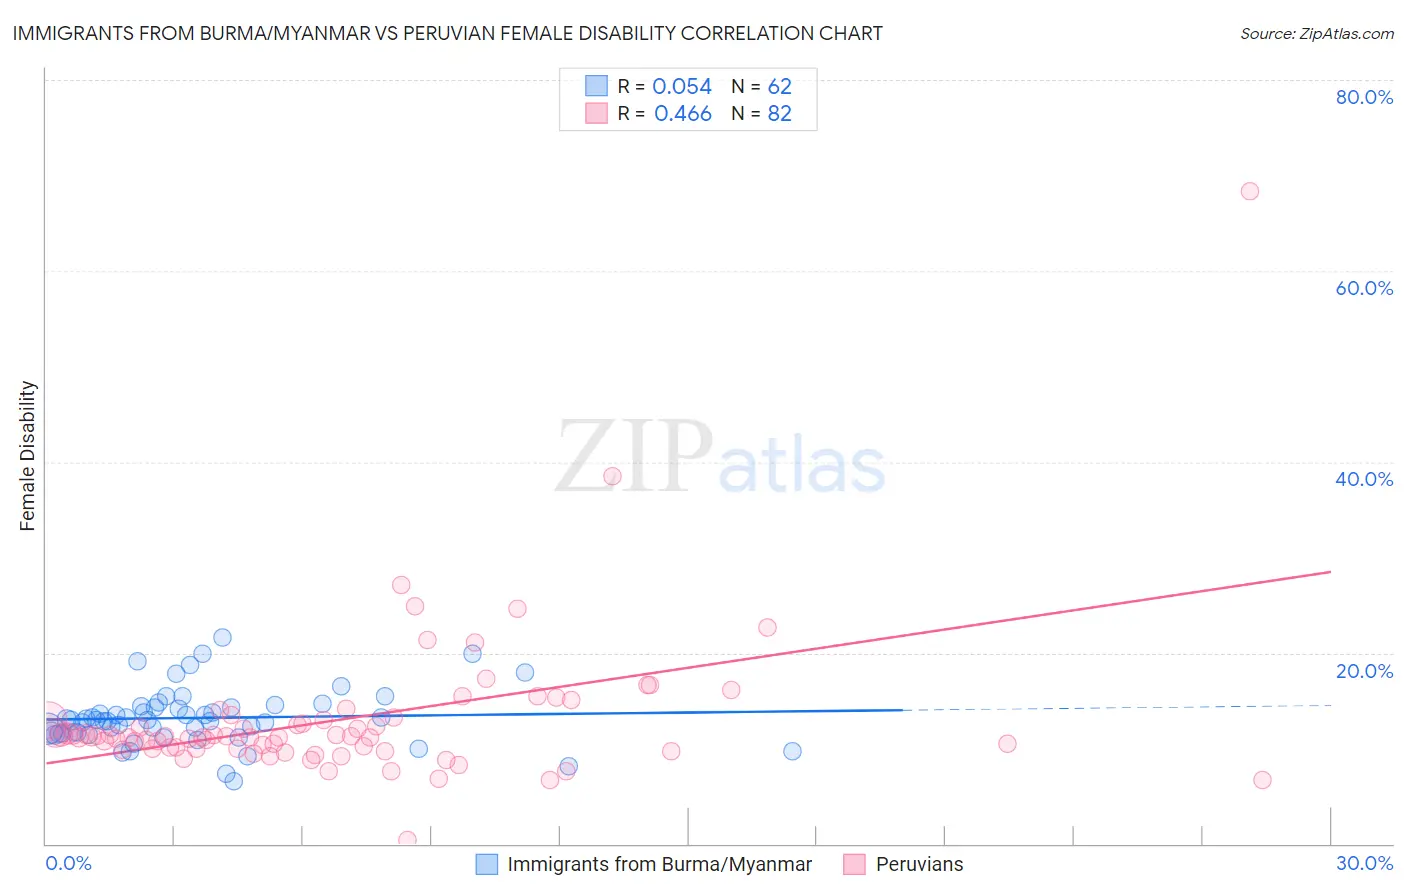
Immigrants from Burma/Myanmar vs Peruvian Female Disability Correlation Chart
The statistical analysis conducted on geographies consisting of 172,344,349 people shows a slight positive correlation between the proportion of Immigrants from Burma/Myanmar and percentage of females with a disability in the United States with a correlation coefficient (R) of 0.054 and weighted average of 12.4%. Similarly, the statistical analysis conducted on geographies consisting of 363,181,047 people shows a moderate positive correlation between the proportion of Peruvians and percentage of females with a disability in the United States with a correlation coefficient (R) of 0.466 and weighted average of 11.3%, a difference of 9.5%.
Female Disability Correlation Summary
| Measurement | Immigrants from Burma/Myanmar | Peruvian |
| Minimum | 6.6% | 0.45% |
| Maximum | 21.6% | 68.3% |
| Range | 15.0% | 67.8% |
| Mean | 13.2% | 13.0% |
| Median | 12.9% | 11.2% |
| Interquartile 25% (IQ1) | 11.6% | 9.9% |
| Interquartile 75% (IQ3) | 14.3% | 13.0% |
| Interquartile Range (IQR) | 2.7% | 3.1% |
| Standard Deviation (Sample) | 2.9% | 8.0% |
| Standard Deviation (Population) | 2.9% | 8.0% |
Similar Demographics by Female Disability
Demographics Similar to Immigrants from Burma/Myanmar by Female Disability
In terms of female disability, the demographic groups most similar to Immigrants from Burma/Myanmar are Panamanian (12.4%, a difference of 0.010%), Samoan (12.4%, a difference of 0.010%), British (12.4%, a difference of 0.050%), Immigrants from Bahamas (12.4%, a difference of 0.070%), and Immigrants from Thailand (12.4%, a difference of 0.090%).
| Demographics | Rating | Rank | Female Disability |
| Mexicans | 15.7 /100 | #209 | Poor 12.4% |
| Swiss | 14.9 /100 | #210 | Poor 12.4% |
| Immigrants | Bosnia and Herzegovina | 14.8 /100 | #211 | Poor 12.4% |
| Ute | 14.7 /100 | #212 | Poor 12.4% |
| Immigrants | Thailand | 14.5 /100 | #213 | Poor 12.4% |
| Panamanians | 13.5 /100 | #214 | Poor 12.4% |
| Samoans | 13.4 /100 | #215 | Poor 12.4% |
| Immigrants | Burma/Myanmar | 13.3 /100 | #216 | Poor 12.4% |
| British | 12.7 /100 | #217 | Poor 12.4% |
| Immigrants | Bahamas | 12.5 /100 | #218 | Poor 12.4% |
| Europeans | 12.1 /100 | #219 | Poor 12.4% |
| Bahamians | 11.1 /100 | #220 | Poor 12.4% |
| Native Hawaiians | 10.8 /100 | #221 | Poor 12.4% |
| Italians | 10.7 /100 | #222 | Poor 12.4% |
| Guamanians/Chamorros | 9.5 /100 | #223 | Tragic 12.5% |
Demographics Similar to Peruvians by Female Disability
In terms of female disability, the demographic groups most similar to Peruvians are Bulgarian (11.3%, a difference of 0.020%), Immigrants from Saudi Arabia (11.3%, a difference of 0.060%), Immigrants from Peru (11.3%, a difference of 0.10%), Immigrants from Belgium (11.3%, a difference of 0.22%), and Taiwanese (11.4%, a difference of 0.25%).
| Demographics | Rating | Rank | Female Disability |
| Jordanians | 100.0 /100 | #47 | Exceptional 11.3% |
| Zimbabweans | 100.0 /100 | #48 | Exceptional 11.3% |
| Tongans | 100.0 /100 | #49 | Exceptional 11.3% |
| Inupiat | 100.0 /100 | #50 | Exceptional 11.3% |
| Immigrants | Belgium | 100.0 /100 | #51 | Exceptional 11.3% |
| Immigrants | Peru | 99.9 /100 | #52 | Exceptional 11.3% |
| Immigrants | Saudi Arabia | 99.9 /100 | #53 | Exceptional 11.3% |
| Peruvians | 99.9 /100 | #54 | Exceptional 11.3% |
| Bulgarians | 99.9 /100 | #55 | Exceptional 11.3% |
| Taiwanese | 99.9 /100 | #56 | Exceptional 11.4% |
| South Americans | 99.9 /100 | #57 | Exceptional 11.4% |
| Laotians | 99.9 /100 | #58 | Exceptional 11.4% |
| Immigrants | Spain | 99.9 /100 | #59 | Exceptional 11.4% |
| Immigrants | Bulgaria | 99.9 /100 | #60 | Exceptional 11.4% |
| Immigrants | France | 99.9 /100 | #61 | Exceptional 11.4% |