Immigrants from Sweden vs Swedish Female Disability
COMPARE
Immigrants from Sweden
Swedish
Female Disability
Female Disability Comparison
Immigrants from Sweden
Swedes
11.3%
FEMALE DISABILITY
100.0/ 100
METRIC RATING
45th/ 347
METRIC RANK
12.3%
FEMALE DISABILITY
26.6/ 100
METRIC RATING
195th/ 347
METRIC RANK
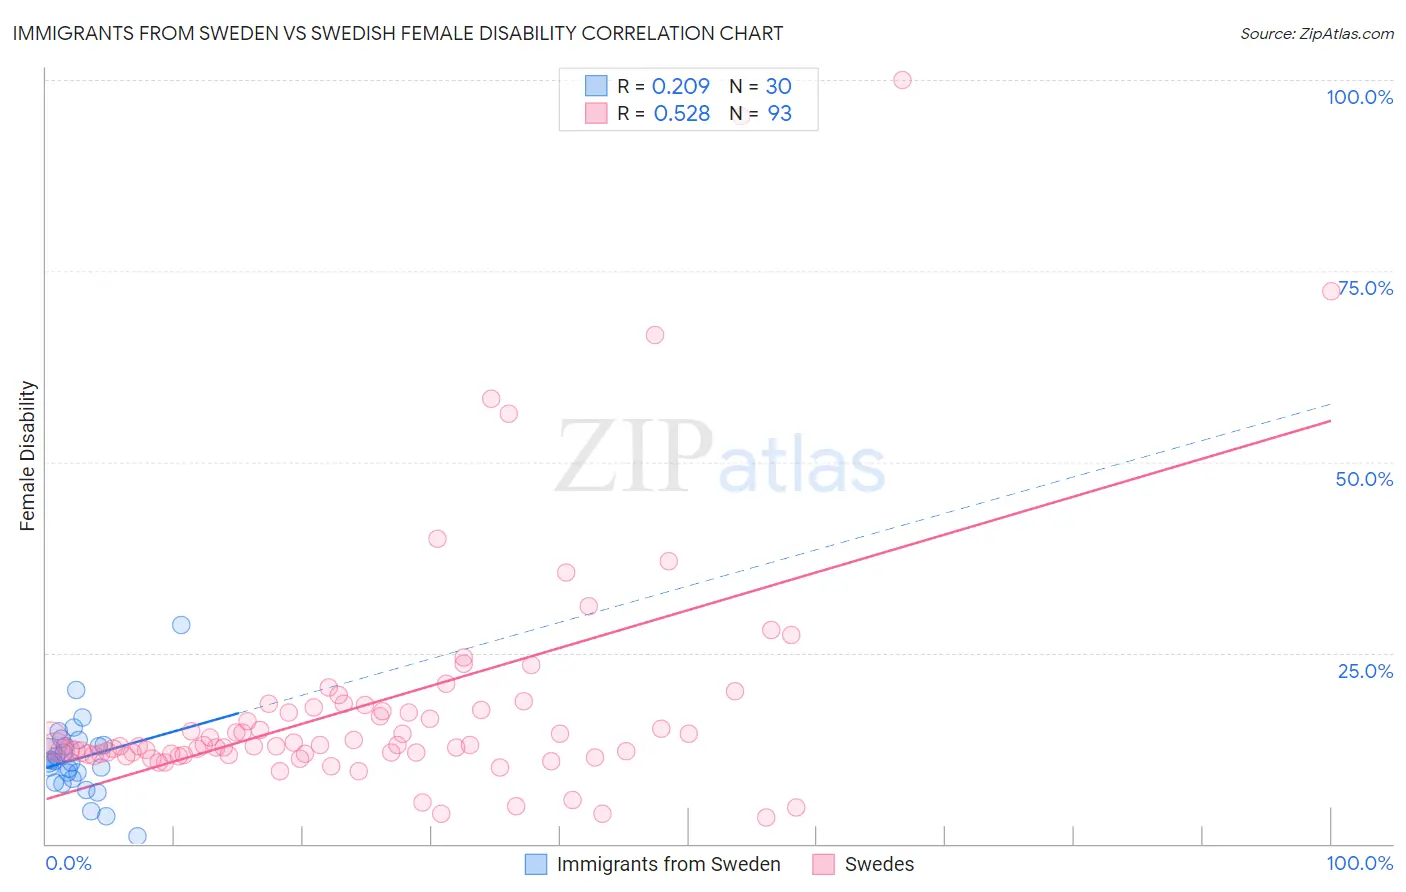
Immigrants from Sweden vs Swedish Female Disability Correlation Chart
The statistical analysis conducted on geographies consisting of 164,745,093 people shows a weak positive correlation between the proportion of Immigrants from Sweden and percentage of females with a disability in the United States with a correlation coefficient (R) of 0.209 and weighted average of 11.3%. Similarly, the statistical analysis conducted on geographies consisting of 539,030,282 people shows a substantial positive correlation between the proportion of Swedes and percentage of females with a disability in the United States with a correlation coefficient (R) of 0.528 and weighted average of 12.3%, a difference of 9.3%.
Female Disability Correlation Summary
| Measurement | Immigrants from Sweden | Swedish |
| Minimum | 0.98% | 3.5% |
| Maximum | 28.6% | 100.0% |
| Range | 27.6% | 96.5% |
| Mean | 11.2% | 18.5% |
| Median | 10.7% | 12.9% |
| Interquartile 25% (IQ1) | 8.5% | 11.7% |
| Interquartile 75% (IQ3) | 12.9% | 18.0% |
| Interquartile Range (IQR) | 4.4% | 6.3% |
| Standard Deviation (Sample) | 5.1% | 16.8% |
| Standard Deviation (Population) | 5.0% | 16.7% |
Similar Demographics by Female Disability
Demographics Similar to Immigrants from Sweden by Female Disability
In terms of female disability, the demographic groups most similar to Immigrants from Sweden are Cambodian (11.3%, a difference of 0.040%), Immigrants from Nepal (11.3%, a difference of 0.050%), Jordanian (11.3%, a difference of 0.060%), Zimbabwean (11.3%, a difference of 0.070%), and Tongan (11.3%, a difference of 0.080%).
| Demographics | Rating | Rank | Female Disability |
| Immigrants | Ethiopia | 100.0 /100 | #38 | Exceptional 11.2% |
| Immigrants | Lithuania | 100.0 /100 | #39 | Exceptional 11.2% |
| Mongolians | 100.0 /100 | #40 | Exceptional 11.2% |
| Paraguayans | 100.0 /100 | #41 | Exceptional 11.2% |
| Israelis | 100.0 /100 | #42 | Exceptional 11.2% |
| Afghans | 100.0 /100 | #43 | Exceptional 11.2% |
| Cambodians | 100.0 /100 | #44 | Exceptional 11.3% |
| Immigrants | Sweden | 100.0 /100 | #45 | Exceptional 11.3% |
| Immigrants | Nepal | 100.0 /100 | #46 | Exceptional 11.3% |
| Jordanians | 100.0 /100 | #47 | Exceptional 11.3% |
| Zimbabweans | 100.0 /100 | #48 | Exceptional 11.3% |
| Tongans | 100.0 /100 | #49 | Exceptional 11.3% |
| Inupiat | 100.0 /100 | #50 | Exceptional 11.3% |
| Immigrants | Belgium | 100.0 /100 | #51 | Exceptional 11.3% |
| Immigrants | Peru | 99.9 /100 | #52 | Exceptional 11.3% |
Demographics Similar to Swedes by Female Disability
In terms of female disability, the demographic groups most similar to Swedes are Ukrainian (12.3%, a difference of 0.030%), Northern European (12.3%, a difference of 0.040%), Immigrants from Panama (12.3%, a difference of 0.060%), Honduran (12.3%, a difference of 0.060%), and Mexican American Indian (12.3%, a difference of 0.080%).
| Demographics | Rating | Rank | Female Disability |
| Immigrants | North America | 32.8 /100 | #188 | Fair 12.3% |
| Immigrants | Albania | 31.6 /100 | #189 | Fair 12.3% |
| Immigrants | Honduras | 31.3 /100 | #190 | Fair 12.3% |
| Armenians | 29.7 /100 | #191 | Fair 12.3% |
| Immigrants | Western Africa | 29.2 /100 | #192 | Fair 12.3% |
| Northern Europeans | 27.5 /100 | #193 | Fair 12.3% |
| Ukrainians | 27.2 /100 | #194 | Fair 12.3% |
| Swedes | 26.6 /100 | #195 | Fair 12.3% |
| Immigrants | Panama | 25.5 /100 | #196 | Fair 12.3% |
| Hondurans | 25.4 /100 | #197 | Fair 12.3% |
| Mexican American Indians | 24.9 /100 | #198 | Fair 12.3% |
| Immigrants | Trinidad and Tobago | 24.7 /100 | #199 | Fair 12.3% |
| Trinidadians and Tobagonians | 22.4 /100 | #200 | Fair 12.3% |
| Chinese | 22.1 /100 | #201 | Fair 12.3% |
| Somalis | 21.5 /100 | #202 | Fair 12.3% |