Immigrants from Burma/Myanmar vs Russian Unemployment Among Ages 20 to 24 years

COMPARE

Immigrants from Burma/Myanmar
Race
Ancestry
AfghanAfricanAlaska NativeAlaskan AthabascanAlbanianAleutAlsatianAmericanApacheArabArapahoArgentineanArmenianAssyrian/Chaldean/SyriacAustralianAustrianBahamianBangladeshiBarbadianBasqueBelgianBelizeanBermudanBhutaneseBlackfeetBolivianBrazilianBritishBritish West IndianBulgarianBurmeseCajunCambodianCanadianCape VerdeanCarpatho RusynCelticCentral AmericanCentral American IndianCherokeeCheyenneChickasawChileanChineseChippewaChoctawColombianColvilleComancheCosta RicanCreeCreekCroatianCrowCubanCypriotCzechCzechoslovakianDanishDelawareDominicanDutchDutch West IndianEastern EuropeanEcuadorianEgyptianEnglishEstonianEthiopianEuropeanFijianFilipinoFinnishFrenchFrench American IndianFrench CanadianGermanGerman RussianGhanaianGreekGuamanian/ChamorroGuatemalanGuyaneseHaitianHmongHonduranHopiHoumaHungarianIcelanderIndian (Asian)IndonesianInupiatIranianIraqiIrishIroquoisIsraeliItalianJamaicanJapaneseJordanianKenyanKiowaKoreanLaotianLatvianLebaneseLiberianLithuanianLumbeeLuxembourgerMacedonianMalaysianMalteseMarshalleseMenomineeMexicanMexican American IndianMongolianMoroccanNative HawaiianNavajoNepaleseNew ZealanderNicaraguanNigerianNorthern EuropeanNorwegianOkinawanOsageOttawaPaiutePakistaniPalestinianPanamanianParaguayanPennsylvania GermanPeruvianPimaPolishPortuguesePotawatomiPuebloPuerto RicanPuget Sound SalishRomanianSalvadoranSamoanScandinavianScotch-IrishScottishSeminoleSenegaleseSerbianShoshoneSierra LeoneanSiouxSlavicSlovakSloveneSomaliSouth AfricanSouth AmericanSouth American IndianSoviet UnionSpaniardSpanishSpanish AmericanSpanish American IndianSri LankanSubsaharan AfricanSudaneseSwedishSwissSyrianTaiwaneseThaiTlingit-HaidaTohono O'OdhamTonganTrinidadian and TobagonianTsimshianTurkishU.S. Virgin IslanderUgandanUkrainianUruguayanUteVenezuelanVietnameseWelshWest IndianYakamaYaquiYugoslavianYumanYup'ikZimbabwean
Immigration
NonimmigrantsImmigrantsAfghanistanAfricaAlbaniaArgentinaArmeniaAsiaAustraliaAustriaBahamasBangladeshBarbadosBelarusBelgiumBelizeBoliviaBosnia and HerzegovinaBrazilBulgariaBurma/MyanmarCabo VerdeCambodiaCameroonCanadaCaribbeanCentral AmericaChileChinaColombiaCongoCosta RicaCroatiaCubaCzechoslovakiaDenmarkDominicaDominican RepublicEastern AfricaEastern AsiaEastern EuropeEcuadorEgyptEl SalvadorEnglandEritreaEthiopiaEuropeFijiFranceGermanyGhanaGreeceGrenadaGuatemalaGuyanaHaitiHondurasHong KongHungaryIndiaIndonesiaIranIraqIrelandIsraelItalyJamaicaJapanJordanKazakhstanKenyaKoreaKuwaitLaosLatin AmericaLatviaLebanonLiberiaLithuaniaMalaysiaMexicoMicronesiaMiddle AfricaMoldovaMoroccoNepalNetherlandsNicaraguaNigeriaNorth AmericaNorth MacedoniaNorthern AfricaNorthern EuropeNorwayOceaniaPakistanPanamaPeruPhilippinesPolandPortugalRomaniaRussiaSaudi ArabiaScotlandSenegalSerbiaSierra LeoneSingaporeSomaliaSouth AfricaSouth AmericaSouth Central AsiaSouth Eastern AsiaSouthern EuropeSpainSri LankaSt. Vincent and the GrenadinesSudanSwedenSwitzerlandSyriaTaiwanThailandTrinidad and TobagoTurkeyUgandaUkraineUruguayUzbekistanVenezuelaVietnamWest IndiesWestern AfricaWestern AsiaWestern EuropeYemenZaireZimbabweAzores
Russian
Race
Ancestry
AfghanAfricanAlaska NativeAlaskan AthabascanAlbanianAleutAlsatianAmericanApacheArabArapahoArgentineanArmenianAssyrian/Chaldean/SyriacAustralianAustrianBahamianBangladeshiBarbadianBasqueBelgianBelizeanBermudanBhutaneseBlackfeetBolivianBrazilianBritishBritish West IndianBulgarianBurmeseCajunCambodianCanadianCape VerdeanCarpatho RusynCelticCentral AmericanCentral American IndianCherokeeCheyenneChickasawChileanChineseChippewaChoctawColombianColvilleComancheCosta RicanCreeCreekCroatianCrowCubanCypriotCzechCzechoslovakianDanishDelawareDominicanDutchDutch West IndianEastern EuropeanEcuadorianEgyptianEnglishEstonianEthiopianEuropeanFijianFilipinoFinnishFrenchFrench American IndianFrench CanadianGermanGerman RussianGhanaianGreekGuamanian/ChamorroGuatemalanGuyaneseHaitianHmongHonduranHopiHoumaHungarianIcelanderIndian (Asian)IndonesianInupiatIranianIraqiIrishIroquoisIsraeliItalianJamaicanJapaneseJordanianKenyanKiowaKoreanLaotianLatvianLebaneseLiberianLithuanianLumbeeLuxembourgerMacedonianMalaysianMalteseMarshalleseMenomineeMexicanMexican American IndianMongolianMoroccanNative HawaiianNavajoNepaleseNew ZealanderNicaraguanNigerianNorthern EuropeanNorwegianOkinawanOsageOttawaPaiutePakistaniPalestinianPanamanianParaguayanPennsylvania GermanPeruvianPimaPolishPortuguesePotawatomiPuebloPuerto RicanPuget Sound SalishRomanianRussianSalvadoranSamoanScandinavianScotch-IrishScottishSeminoleSenegaleseSerbianShoshoneSierra LeoneanSiouxSlavicSlovakSloveneSomaliSouth AfricanSouth AmericanSouth American IndianSoviet UnionSpaniardSpanishSpanish AmericanSpanish American IndianSri LankanSubsaharan AfricanSudaneseSwedishSwissSyrianTaiwaneseThaiTlingit-HaidaTohono O'OdhamTonganTrinidadian and TobagonianTsimshianTurkishU.S. Virgin IslanderUgandanUkrainianUruguayanUteVenezuelanVietnameseWelshWest IndianYakamaYaquiYugoslavianYumanYup'ikZimbabwean
Immigration
NonimmigrantsImmigrantsAfghanistanAfricaAlbaniaArgentinaArmeniaAsiaAustraliaAustriaBahamasBangladeshBarbadosBelarusBelgiumBelizeBoliviaBosnia and HerzegovinaBrazilBulgariaCabo VerdeCambodiaCameroonCanadaCaribbeanCentral AmericaChileChinaColombiaCongoCosta RicaCroatiaCubaCzechoslovakiaDenmarkDominicaDominican RepublicEastern AfricaEastern AsiaEastern EuropeEcuadorEgyptEl SalvadorEnglandEritreaEthiopiaEuropeFijiFranceGermanyGhanaGreeceGrenadaGuatemalaGuyanaHaitiHondurasHong KongHungaryIndiaIndonesiaIranIraqIrelandIsraelItalyJamaicaJapanJordanKazakhstanKenyaKoreaKuwaitLaosLatin AmericaLatviaLebanonLiberiaLithuaniaMalaysiaMexicoMicronesiaMiddle AfricaMoldovaMoroccoNepalNetherlandsNicaraguaNigeriaNorth AmericaNorth MacedoniaNorthern AfricaNorthern EuropeNorwayOceaniaPakistanPanamaPeruPhilippinesPolandPortugalRomaniaRussiaSaudi ArabiaScotlandSenegalSerbiaSierra LeoneSingaporeSomaliaSouth AfricaSouth AmericaSouth Central AsiaSouth Eastern AsiaSouthern EuropeSpainSri LankaSt. Vincent and the GrenadinesSudanSwedenSwitzerlandSyriaTaiwanThailandTrinidad and TobagoTurkeyUgandaUkraineUruguayUzbekistanVenezuelaVietnamWest IndiesWestern AfricaWestern AsiaWestern EuropeYemenZaireZimbabweAzores
Unemployment Among Ages 20 to 24 years
Income
Poverty
Unemployment
Labor Participation
Family Structure
Vehicle Availability
Education Level
Disability

Unemployment Among Ages 20 to 24 years Comparison

Immigrants from Burma/Myanmar

Russians

Exceptional
Fair
9.1%
UNEMPLOYMENT AMONG AGES 20 TO 24 YEARS
100.0/ 100
METRIC RATING
6th/ 347
METRIC RANK
10.4%
UNEMPLOYMENT AMONG AGES 20 TO 24 YEARS
21.2/ 100
METRIC RATING
200th/ 347
METRIC RANK

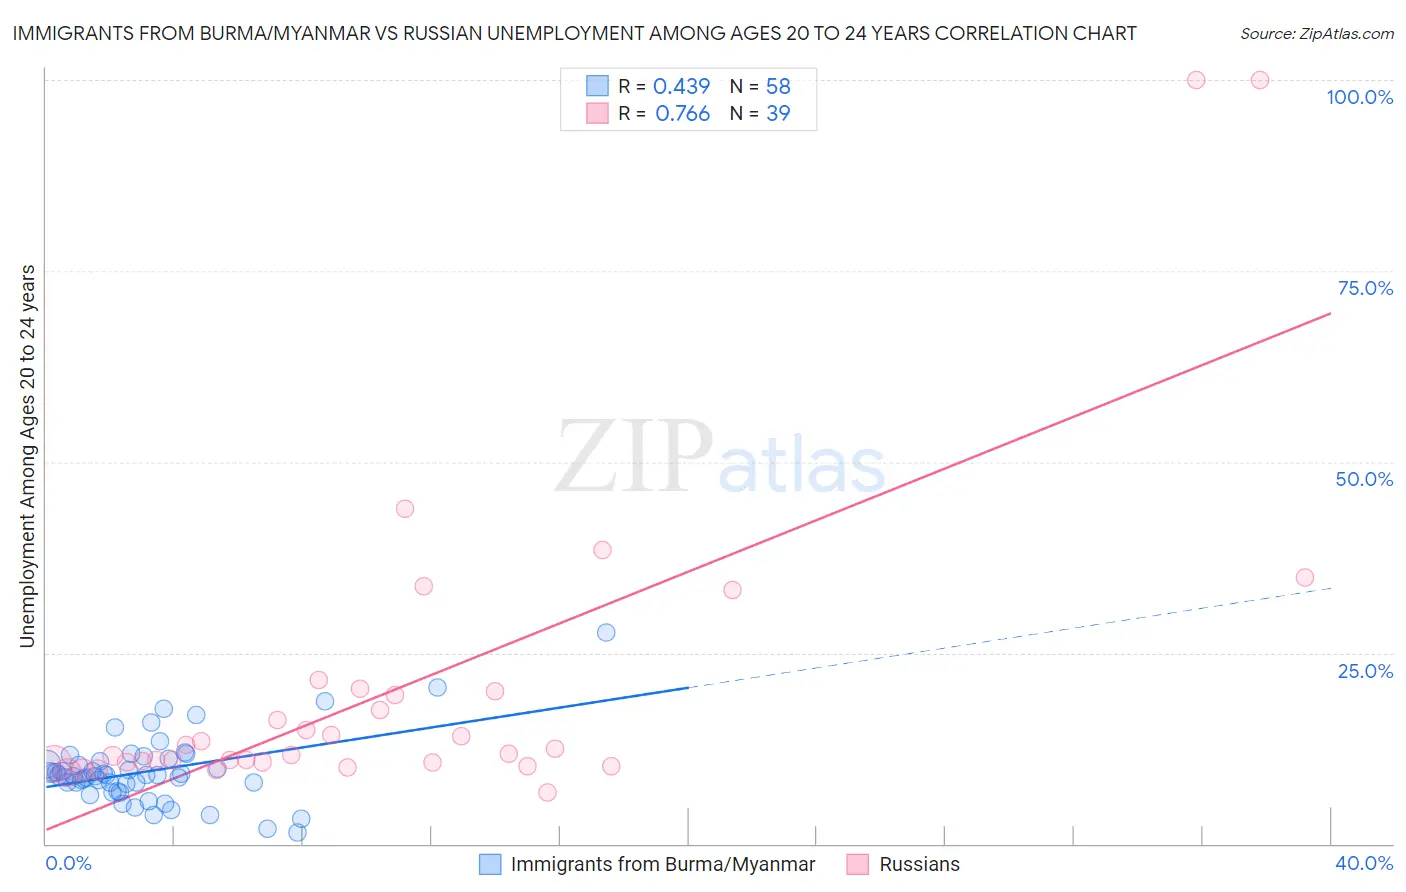
Immigrants from Burma/Myanmar vs Russian Unemployment Among Ages 20 to 24 years Correlation Chart

The statistical analysis conducted on geographies consisting of 170,830,941 people shows a moderate positive correlation between the proportion of Immigrants from Burma/Myanmar and unemployment rate among population between the ages 20 and 24 in the United States with a correlation coefficient (R) of 0.439 and weighted average of 9.1%. Similarly, the statistical analysis conducted on geographies consisting of 481,885,535 people shows a strong positive correlation between the proportion of Russians and unemployment rate among population between the ages 20 and 24 in the United States with a correlation coefficient (R) of 0.766 and weighted average of 10.4%, a difference of 14.8%.
Immigrants from Burma/Myanmar vs Russian Unemployment Among Ages 20 to 24 years

Unemployment Among Ages 20 to 24 years Correlation Summary

MeasurementImmigrants from Burma/MyanmarRussian
Minimum1.5%6.7%
Maximum27.6%100.0%
Range26.1%93.3%
Mean9.5%20.2%
Median8.9%11.8%
Interquartile 25% (IQ1)7.8%10.7%
Interquartile 75% (IQ3)10.8%20.0%
Interquartile Range (IQR)3.0%9.3%
Standard Deviation (Sample)4.5%20.8%
Standard Deviation (Population)4.4%20.5%

Similar Demographics by Unemployment Among Ages 20 to 24 years

Demographics Similar to Immigrants from Burma/Myanmar by Unemployment Among Ages 20 to 24 years

In terms of unemployment among ages 20 to 24 years, the demographic groups most similar to Immigrants from Burma/Myanmar are Luxembourger (9.1%, a difference of 0.36%), Somali (9.1%, a difference of 0.38%), Norwegian (9.0%, a difference of 0.60%), Immigrants from Somalia (9.2%, a difference of 0.73%), and Venezuelan (9.0%, a difference of 0.82%).
DemographicsRating | RankUnemployment Among Ages 20 to 24 years
Immigrants | Cuba
100.0
/100
|
#1
Exceptional
8.7%
Immigrants | Venezuela
100.0
/100
|
#2
Exceptional
8.9%
Indonesians
100.0
/100
|
#3
Exceptional
9.0%
Venezuelans
100.0
/100
|
#4
Exceptional
9.0%
Norwegians
100.0
/100
|
#5
Exceptional
9.0%
Immigrants | Burma/Myanmar
100.0
/100
|
#6
Exceptional
9.1%
Luxembourgers
100.0
/100
|
#7
Exceptional
9.1%
Somalis
100.0
/100
|
#8
Exceptional
9.1%
Immigrants | Somalia
100.0
/100
|
#9
Exceptional
9.2%
Sudanese
100.0
/100
|
#10
Exceptional
9.2%
Zimbabweans
100.0
/100
|
#11
Exceptional
9.2%
Cubans
100.0
/100
|
#12
Exceptional
9.2%
Immigrants | Congo
100.0
/100
|
#13
Exceptional
9.2%
Slovenes
100.0
/100
|
#14
Exceptional
9.3%
Immigrants | Sudan
100.0
/100
|
#15
Exceptional
9.3%

Demographics Similar to Russians by Unemployment Among Ages 20 to 24 years

In terms of unemployment among ages 20 to 24 years, the demographic groups most similar to Russians are Immigrants from Peru (10.4%, a difference of 0.0%), Immigrants from Middle Africa (10.4%, a difference of 0.020%), Portuguese (10.4%, a difference of 0.030%), South American (10.4%, a difference of 0.040%), and Colombian (10.4%, a difference of 0.060%).
DemographicsRating | RankUnemployment Among Ages 20 to 24 years
Immigrants | Portugal
25.3
/100
|
#193
Fair
10.4%
Immigrants | Italy
25.0
/100
|
#194
Fair
10.4%
Egyptians
24.5
/100
|
#195
Fair
10.4%
Immigrants | Philippines
24.1
/100
|
#196
Fair
10.4%
Immigrants | Denmark
22.8
/100
|
#197
Fair
10.4%
Colombians
22.3
/100
|
#198
Fair
10.4%
Portuguese
21.8
/100
|
#199
Fair
10.4%
Russians
21.2
/100
|
#200
Fair
10.4%
Immigrants | Peru
21.2
/100
|
#201
Fair
10.4%
Immigrants | Middle Africa
20.9
/100
|
#202
Fair
10.4%
South Americans
20.6
/100
|
#203
Fair
10.4%
Immigrants | Northern Europe
19.5
/100
|
#204
Poor
10.4%
Cypriots
18.9
/100
|
#205
Poor
10.4%
Immigrants | Europe
18.5
/100
|
#206
Poor
10.4%
Immigrants | Honduras
17.9
/100
|
#207
Poor
10.4%