Kiowa vs Lithuanian Disability Age 65 to 74
COMPARE
Kiowa
Lithuanian
Disability Age 65 to 74
Disability Age 65 to 74 Comparison
Kiowa
Lithuanians
32.6%
DISABILITY AGE 65 TO 74
0.0/ 100
METRIC RATING
339th/ 347
METRIC RANK
21.4%
DISABILITY AGE 65 TO 74
99.7/ 100
METRIC RATING
48th/ 347
METRIC RANK
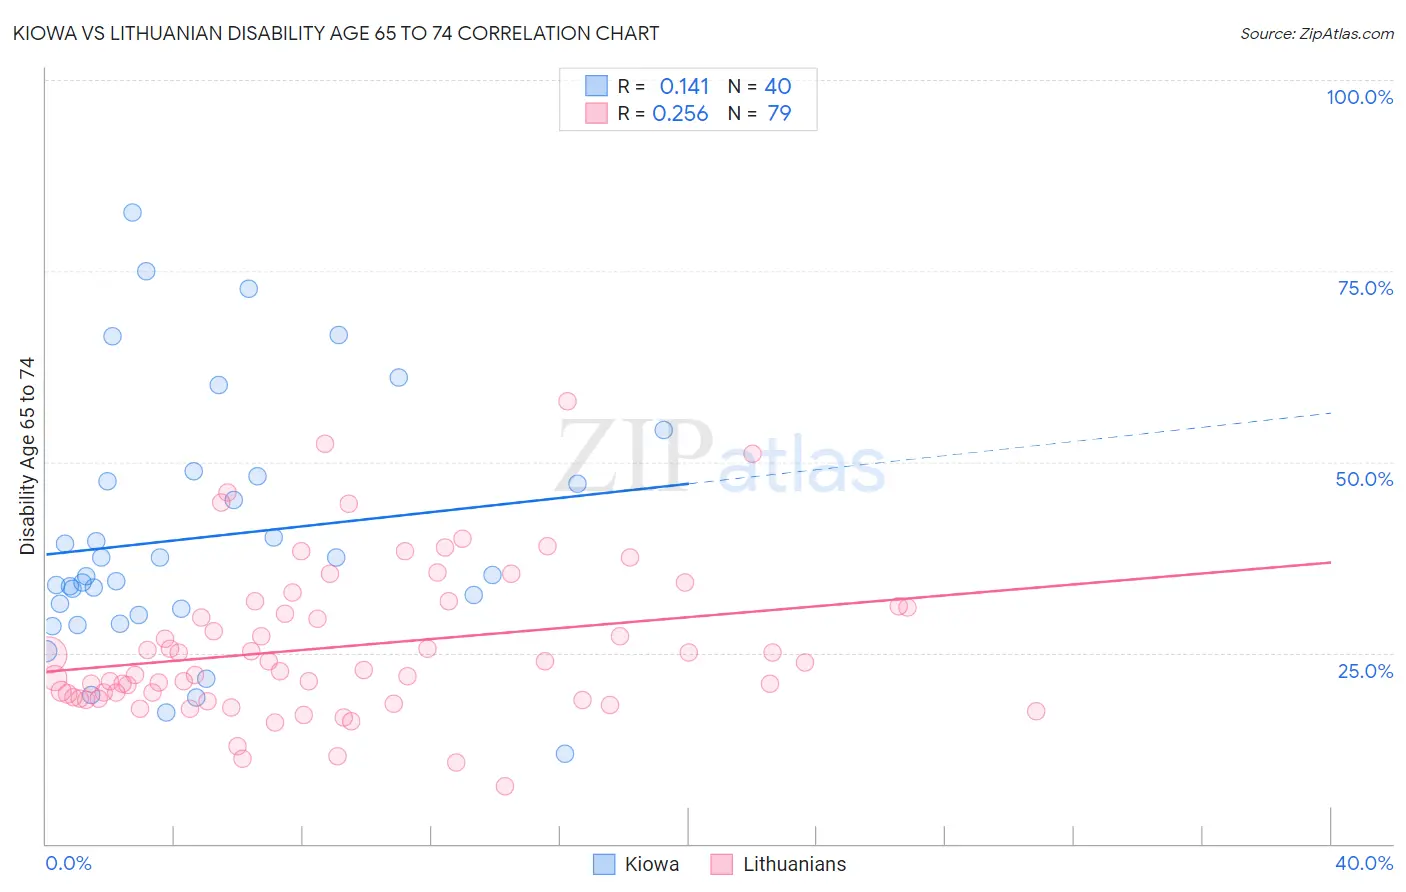
Kiowa vs Lithuanian Disability Age 65 to 74 Correlation Chart
The statistical analysis conducted on geographies consisting of 56,067,785 people shows a poor positive correlation between the proportion of Kiowa and percentage of population with a disability between the ages 65 and 75 in the United States with a correlation coefficient (R) of 0.141 and weighted average of 32.6%. Similarly, the statistical analysis conducted on geographies consisting of 421,207,937 people shows a weak positive correlation between the proportion of Lithuanians and percentage of population with a disability between the ages 65 and 75 in the United States with a correlation coefficient (R) of 0.256 and weighted average of 21.4%, a difference of 52.2%.
Disability Age 65 to 74 Correlation Summary
| Measurement | Kiowa | Lithuanian |
| Minimum | 11.7% | 7.6% |
| Maximum | 82.6% | 57.9% |
| Range | 70.9% | 50.3% |
| Mean | 40.1% | 25.8% |
| Median | 35.1% | 22.8% |
| Interquartile 25% (IQ1) | 30.3% | 19.1% |
| Interquartile 75% (IQ3) | 47.7% | 31.1% |
| Interquartile Range (IQR) | 17.4% | 12.0% |
| Standard Deviation (Sample) | 16.5% | 9.9% |
| Standard Deviation (Population) | 16.3% | 9.9% |
Similar Demographics by Disability Age 65 to 74
Demographics Similar to Kiowa by Disability Age 65 to 74
In terms of disability age 65 to 74, the demographic groups most similar to Kiowa are Lumbee (32.7%, a difference of 0.52%), Alaskan Athabascan (32.4%, a difference of 0.62%), Houma (32.3%, a difference of 0.81%), Tsimshian (32.9%, a difference of 1.1%), and Pueblo (33.1%, a difference of 1.7%).
| Demographics | Rating | Rank | Disability Age 65 to 74 |
| Natives/Alaskans | 0.0 /100 | #332 | Tragic 30.4% |
| Colville | 0.0 /100 | #333 | Tragic 30.5% |
| Alaska Natives | 0.0 /100 | #334 | Tragic 30.6% |
| Cheyenne | 0.0 /100 | #335 | Tragic 31.1% |
| Yuman | 0.0 /100 | #336 | Tragic 31.5% |
| Houma | 0.0 /100 | #337 | Tragic 32.3% |
| Alaskan Athabascans | 0.0 /100 | #338 | Tragic 32.4% |
| Kiowa | 0.0 /100 | #339 | Tragic 32.6% |
| Lumbee | 0.0 /100 | #340 | Tragic 32.7% |
| Tsimshian | 0.0 /100 | #341 | Tragic 32.9% |
| Pueblo | 0.0 /100 | #342 | Tragic 33.1% |
| Navajo | 0.0 /100 | #343 | Tragic 33.3% |
| Inupiat | 0.0 /100 | #344 | Tragic 34.5% |
| Tohono O'odham | 0.0 /100 | #345 | Tragic 36.0% |
| Yup'ik | 0.0 /100 | #346 | Tragic 37.8% |
Demographics Similar to Lithuanians by Disability Age 65 to 74
In terms of disability age 65 to 74, the demographic groups most similar to Lithuanians are Luxembourger (21.4%, a difference of 0.010%), Immigrants from Malaysia (21.4%, a difference of 0.030%), Immigrants from Turkey (21.4%, a difference of 0.050%), Immigrants from Bulgaria (21.4%, a difference of 0.050%), and Asian (21.4%, a difference of 0.080%).
| Demographics | Rating | Rank | Disability Age 65 to 74 |
| Immigrants | Austria | 99.8 /100 | #41 | Exceptional 21.2% |
| Macedonians | 99.7 /100 | #42 | Exceptional 21.3% |
| Immigrants | Croatia | 99.7 /100 | #43 | Exceptional 21.3% |
| Estonians | 99.7 /100 | #44 | Exceptional 21.4% |
| Asians | 99.7 /100 | #45 | Exceptional 21.4% |
| Immigrants | Turkey | 99.7 /100 | #46 | Exceptional 21.4% |
| Immigrants | Bulgaria | 99.7 /100 | #47 | Exceptional 21.4% |
| Lithuanians | 99.7 /100 | #48 | Exceptional 21.4% |
| Luxembourgers | 99.7 /100 | #49 | Exceptional 21.4% |
| Immigrants | Malaysia | 99.7 /100 | #50 | Exceptional 21.4% |
| Immigrants | Serbia | 99.6 /100 | #51 | Exceptional 21.4% |
| Immigrants | France | 99.6 /100 | #52 | Exceptional 21.5% |
| Bhutanese | 99.6 /100 | #53 | Exceptional 21.5% |
| Immigrants | Italy | 99.6 /100 | #54 | Exceptional 21.5% |
| Immigrants | Romania | 99.5 /100 | #55 | Exceptional 21.5% |