Delaware vs Romanian Hearing Disability
COMPARE
Delaware
Romanian
Hearing Disability
Hearing Disability Comparison
Delaware
Romanians
3.6%
HEARING DISABILITY
0.0/ 100
METRIC RATING
286th/ 347
METRIC RANK
3.1%
HEARING DISABILITY
12.1/ 100
METRIC RATING
211th/ 347
METRIC RANK
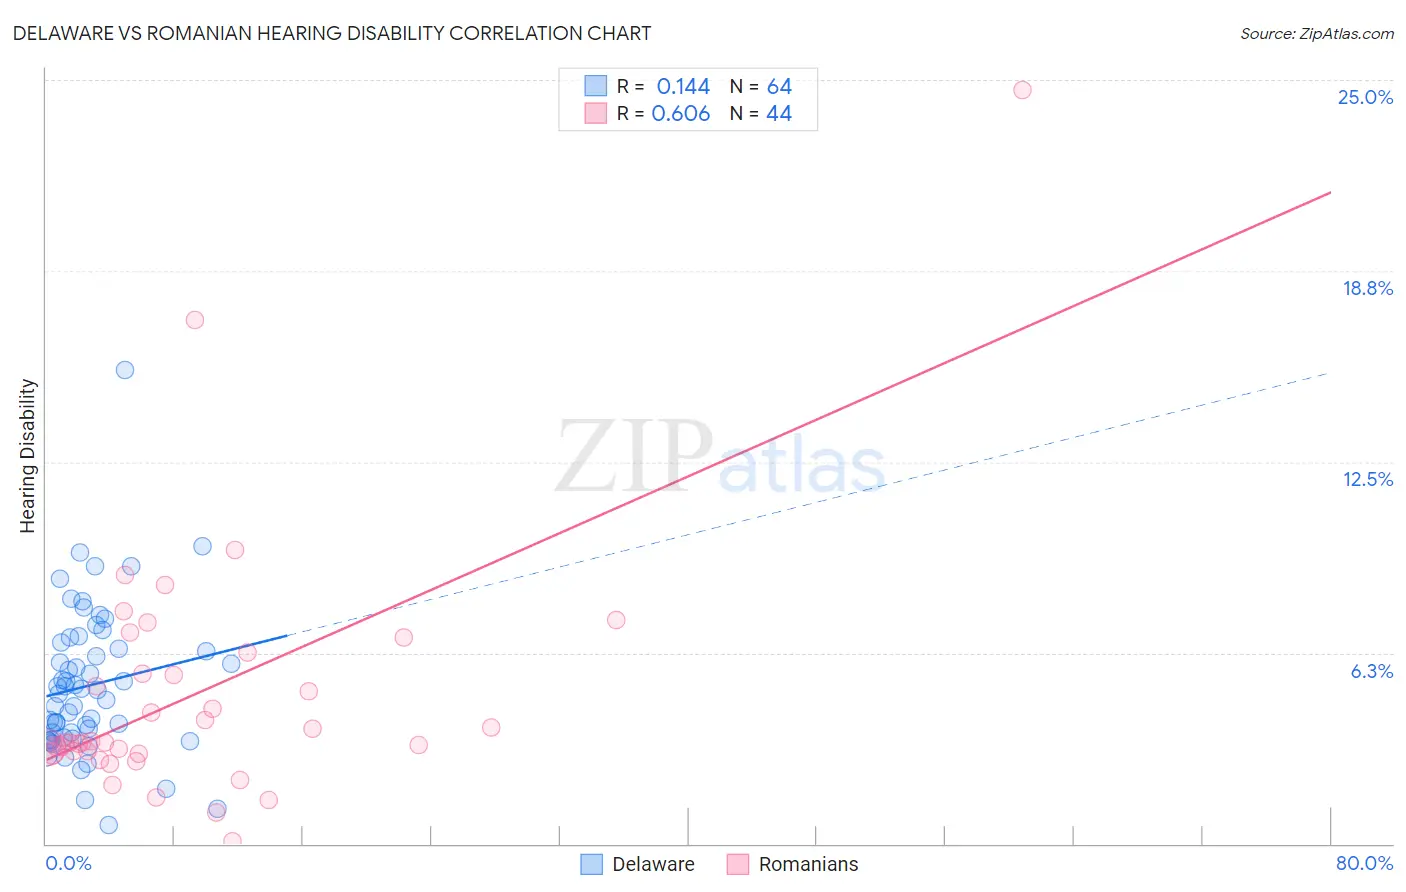
Delaware vs Romanian Hearing Disability Correlation Chart
The statistical analysis conducted on geographies consisting of 96,230,255 people shows a poor positive correlation between the proportion of Delaware and percentage of population with hearing disability in the United States with a correlation coefficient (R) of 0.144 and weighted average of 3.6%. Similarly, the statistical analysis conducted on geographies consisting of 377,801,954 people shows a significant positive correlation between the proportion of Romanians and percentage of population with hearing disability in the United States with a correlation coefficient (R) of 0.606 and weighted average of 3.1%, a difference of 16.2%.
Hearing Disability Correlation Summary
| Measurement | Delaware | Romanian |
| Minimum | 0.61% | 0.091% |
| Maximum | 15.5% | 24.7% |
| Range | 14.9% | 24.6% |
| Mean | 5.2% | 4.9% |
| Median | 5.0% | 3.3% |
| Interquartile 25% (IQ1) | 3.5% | 3.0% |
| Interquartile 75% (IQ3) | 6.5% | 5.9% |
| Interquartile Range (IQR) | 3.0% | 2.9% |
| Standard Deviation (Sample) | 2.4% | 4.2% |
| Standard Deviation (Population) | 2.4% | 4.2% |
Similar Demographics by Hearing Disability
Demographics Similar to Delaware by Hearing Disability
In terms of hearing disability, the demographic groups most similar to Delaware are Sioux (3.6%, a difference of 0.030%), Immigrants from Micronesia (3.6%, a difference of 0.13%), Spanish (3.7%, a difference of 0.24%), Blackfeet (3.6%, a difference of 0.60%), and Irish (3.7%, a difference of 0.82%).
| Demographics | Rating | Rank | Hearing Disability |
| Slovaks | 0.0 /100 | #279 | Tragic 3.6% |
| French American Indians | 0.0 /100 | #280 | Tragic 3.6% |
| Scandinavians | 0.0 /100 | #281 | Tragic 3.6% |
| Swedes | 0.0 /100 | #282 | Tragic 3.6% |
| Blackfeet | 0.0 /100 | #283 | Tragic 3.6% |
| Immigrants | Micronesia | 0.0 /100 | #284 | Tragic 3.6% |
| Sioux | 0.0 /100 | #285 | Tragic 3.6% |
| Delaware | 0.0 /100 | #286 | Tragic 3.6% |
| Spanish | 0.0 /100 | #287 | Tragic 3.7% |
| Irish | 0.0 /100 | #288 | Tragic 3.7% |
| Chinese | 0.0 /100 | #289 | Tragic 3.7% |
| Whites/Caucasians | 0.0 /100 | #290 | Tragic 3.7% |
| Finns | 0.0 /100 | #291 | Tragic 3.7% |
| Native Hawaiians | 0.0 /100 | #292 | Tragic 3.7% |
| Norwegians | 0.0 /100 | #293 | Tragic 3.7% |
Demographics Similar to Romanians by Hearing Disability
In terms of hearing disability, the demographic groups most similar to Romanians are Cape Verdean (3.1%, a difference of 0.040%), Immigrants from Hungary (3.1%, a difference of 0.080%), Immigrants from Latvia (3.1%, a difference of 0.13%), Pakistani (3.1%, a difference of 0.21%), and Immigrants from Iraq (3.1%, a difference of 0.36%).
| Demographics | Rating | Rank | Hearing Disability |
| Immigrants | Czechoslovakia | 15.9 /100 | #204 | Poor 3.1% |
| Alsatians | 15.9 /100 | #205 | Poor 3.1% |
| Eastern Europeans | 15.5 /100 | #206 | Poor 3.1% |
| Hispanics or Latinos | 15.1 /100 | #207 | Poor 3.1% |
| Immigrants | Latvia | 12.7 /100 | #208 | Poor 3.1% |
| Immigrants | Hungary | 12.5 /100 | #209 | Poor 3.1% |
| Cape Verdeans | 12.2 /100 | #210 | Poor 3.1% |
| Romanians | 12.1 /100 | #211 | Poor 3.1% |
| Pakistanis | 11.1 /100 | #212 | Poor 3.1% |
| Immigrants | Iraq | 10.5 /100 | #213 | Poor 3.1% |
| Australians | 8.1 /100 | #214 | Tragic 3.2% |
| Bangladeshis | 8.1 /100 | #215 | Tragic 3.2% |
| Immigrants | Norway | 7.3 /100 | #216 | Tragic 3.2% |
| Russians | 7.1 /100 | #217 | Tragic 3.2% |
| Immigrants | Northern Europe | 7.0 /100 | #218 | Tragic 3.2% |