Immigrants from Bolivia vs German Russian Unemployment Among Ages 30 to 34 years
COMPARE
Immigrants from Bolivia
German Russian
Unemployment Among Ages 30 to 34 years
Unemployment Among Ages 30 to 34 years Comparison
Immigrants from Bolivia
German Russians
4.8%
UNEMPLOYMENT AMONG AGES 30 TO 34 YEARS
99.9/ 100
METRIC RATING
11th/ 347
METRIC RANK
5.0%
UNEMPLOYMENT AMONG AGES 30 TO 34 YEARS
99.4/ 100
METRIC RATING
29th/ 347
METRIC RANK
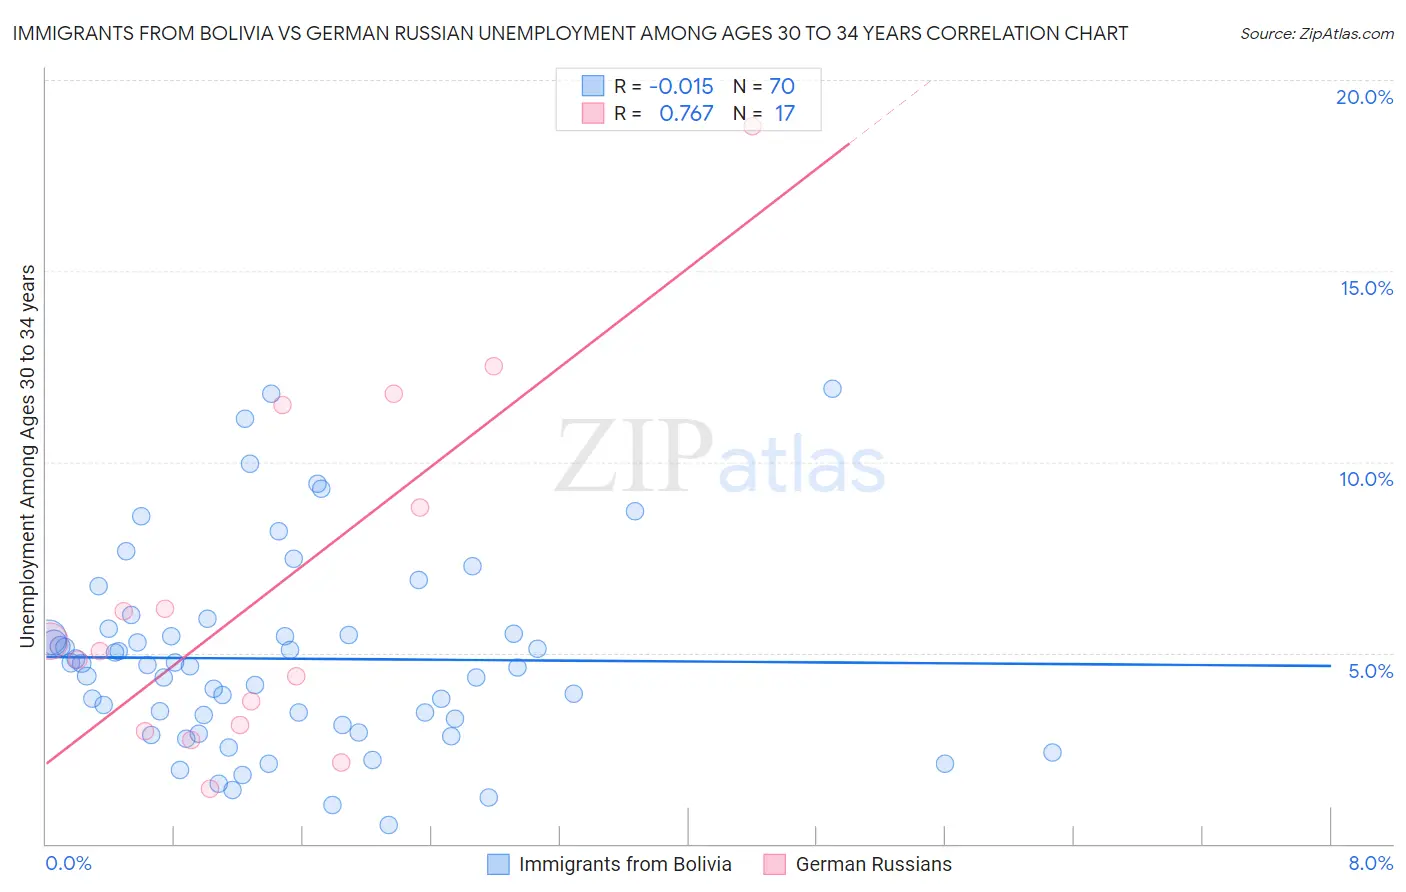
Immigrants from Bolivia vs German Russian Unemployment Among Ages 30 to 34 years Correlation Chart
The statistical analysis conducted on geographies consisting of 155,484,610 people shows no correlation between the proportion of Immigrants from Bolivia and unemployment rate among population between the ages 30 and 34 in the United States with a correlation coefficient (R) of -0.015 and weighted average of 4.8%. Similarly, the statistical analysis conducted on geographies consisting of 94,856,577 people shows a strong positive correlation between the proportion of German Russians and unemployment rate among population between the ages 30 and 34 in the United States with a correlation coefficient (R) of 0.767 and weighted average of 5.0%, a difference of 4.8%.
Unemployment Among Ages 30 to 34 years Correlation Summary
| Measurement | Immigrants from Bolivia | German Russian |
| Minimum | 0.50% | 1.5% |
| Maximum | 11.9% | 18.8% |
| Range | 11.4% | 17.3% |
| Mean | 4.8% | 6.5% |
| Median | 4.7% | 5.0% |
| Interquartile 25% (IQ1) | 3.1% | 3.0% |
| Interquartile 75% (IQ3) | 5.5% | 10.2% |
| Interquartile Range (IQR) | 2.4% | 7.1% |
| Standard Deviation (Sample) | 2.5% | 4.7% |
| Standard Deviation (Population) | 2.5% | 4.5% |
Demographics Similar to Immigrants from Bolivia and German Russians by Unemployment Among Ages 30 to 34 years
In terms of unemployment among ages 30 to 34 years, the demographic groups most similar to Immigrants from Bolivia are Tongan (4.8%, a difference of 0.030%), Filipino (4.8%, a difference of 1.2%), Cambodian (4.8%, a difference of 1.2%), Luxembourger (4.8%, a difference of 1.2%), and Okinawan (4.8%, a difference of 1.6%). Similarly, the demographic groups most similar to German Russians are Immigrants from Cuba (5.0%, a difference of 0.020%), Norwegian (5.0%, a difference of 0.020%), Danish (5.0%, a difference of 0.26%), Immigrants from Kuwait (5.0%, a difference of 0.37%), and Immigrants from Singapore (5.0%, a difference of 0.54%).
| Demographics | Rating | Rank | Unemployment Among Ages 30 to 34 years |
| Tongans | 99.9 /100 | #10 | Exceptional 4.8% |
| Immigrants | Bolivia | 99.9 /100 | #11 | Exceptional 4.8% |
| Filipinos | 99.9 /100 | #12 | Exceptional 4.8% |
| Cambodians | 99.9 /100 | #13 | Exceptional 4.8% |
| Luxembourgers | 99.9 /100 | #14 | Exceptional 4.8% |
| Okinawans | 99.9 /100 | #15 | Exceptional 4.8% |
| Zimbabweans | 99.9 /100 | #16 | Exceptional 4.8% |
| Immigrants | Bulgaria | 99.9 /100 | #17 | Exceptional 4.8% |
| Bolivians | 99.8 /100 | #18 | Exceptional 4.9% |
| Immigrants | Sudan | 99.8 /100 | #19 | Exceptional 4.9% |
| Immigrants | Taiwan | 99.8 /100 | #20 | Exceptional 4.9% |
| Ethiopians | 99.8 /100 | #21 | Exceptional 4.9% |
| Immigrants | South Central Asia | 99.8 /100 | #22 | Exceptional 4.9% |
| Hmong | 99.8 /100 | #23 | Exceptional 4.9% |
| Ugandans | 99.7 /100 | #24 | Exceptional 4.9% |
| Immigrants | Singapore | 99.5 /100 | #25 | Exceptional 5.0% |
| Immigrants | Kuwait | 99.5 /100 | #26 | Exceptional 5.0% |
| Danes | 99.5 /100 | #27 | Exceptional 5.0% |
| Immigrants | Cuba | 99.4 /100 | #28 | Exceptional 5.0% |
| German Russians | 99.4 /100 | #29 | Exceptional 5.0% |
| Norwegians | 99.4 /100 | #30 | Exceptional 5.0% |