Immigrants from Belarus vs German Vision Disability
COMPARE
Immigrants from Belarus
German
Vision Disability
Vision Disability Comparison
Immigrants from Belarus
Germans
2.0%
VISION DISABILITY
99.3/ 100
METRIC RATING
53rd/ 347
METRIC RANK
2.2%
VISION DISABILITY
13.4/ 100
METRIC RATING
208th/ 347
METRIC RANK
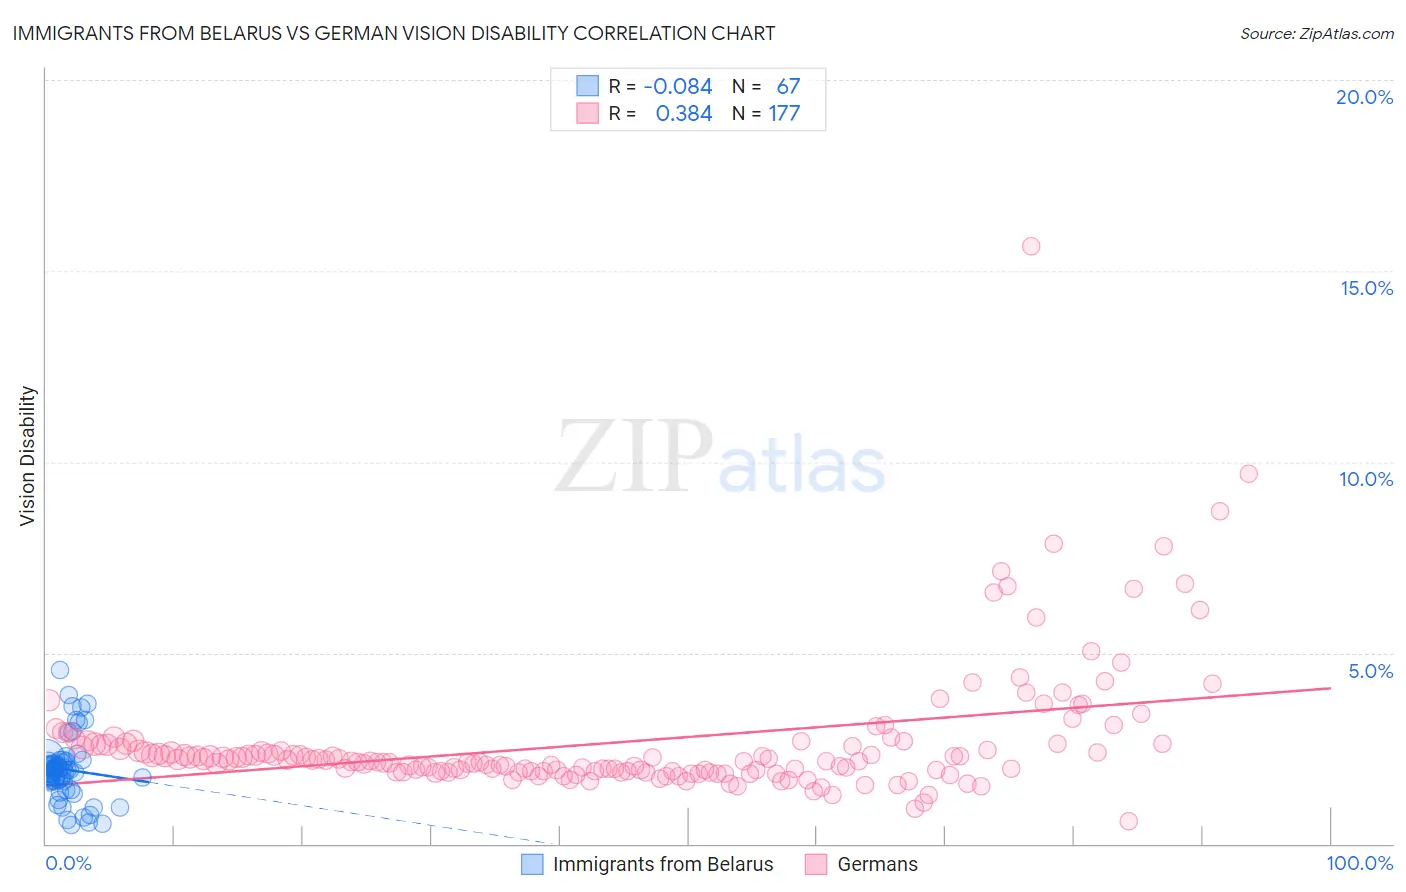
Immigrants from Belarus vs German Vision Disability Correlation Chart
The statistical analysis conducted on geographies consisting of 150,159,443 people shows a slight negative correlation between the proportion of Immigrants from Belarus and percentage of population with vision disability in the United States with a correlation coefficient (R) of -0.084 and weighted average of 2.0%. Similarly, the statistical analysis conducted on geographies consisting of 578,195,961 people shows a mild positive correlation between the proportion of Germans and percentage of population with vision disability in the United States with a correlation coefficient (R) of 0.384 and weighted average of 2.2%, a difference of 11.8%.
Vision Disability Correlation Summary
| Measurement | Immigrants from Belarus | German |
| Minimum | 0.50% | 0.58% |
| Maximum | 4.6% | 15.7% |
| Range | 4.1% | 15.1% |
| Mean | 1.9% | 2.7% |
| Median | 1.9% | 2.2% |
| Interquartile 25% (IQ1) | 1.6% | 1.9% |
| Interquartile 75% (IQ3) | 2.2% | 2.6% |
| Interquartile Range (IQR) | 0.52% | 0.71% |
| Standard Deviation (Sample) | 0.82% | 1.7% |
| Standard Deviation (Population) | 0.81% | 1.7% |
Similar Demographics by Vision Disability
Demographics Similar to Immigrants from Belarus by Vision Disability
In terms of vision disability, the demographic groups most similar to Immigrants from Belarus are Macedonian (2.0%, a difference of 0.040%), Laotian (2.0%, a difference of 0.090%), Immigrants from Serbia (2.0%, a difference of 0.11%), Jordanian (2.0%, a difference of 0.26%), and Somali (2.0%, a difference of 0.28%).
| Demographics | Rating | Rank | Vision Disability |
| Immigrants | Sweden | 99.7 /100 | #46 | Exceptional 2.0% |
| Immigrants | Bulgaria | 99.7 /100 | #47 | Exceptional 2.0% |
| Israelis | 99.6 /100 | #48 | Exceptional 2.0% |
| Latvians | 99.5 /100 | #49 | Exceptional 2.0% |
| Afghans | 99.5 /100 | #50 | Exceptional 2.0% |
| Tongans | 99.5 /100 | #51 | Exceptional 2.0% |
| Immigrants | Serbia | 99.4 /100 | #52 | Exceptional 2.0% |
| Immigrants | Belarus | 99.3 /100 | #53 | Exceptional 2.0% |
| Macedonians | 99.3 /100 | #54 | Exceptional 2.0% |
| Laotians | 99.3 /100 | #55 | Exceptional 2.0% |
| Jordanians | 99.2 /100 | #56 | Exceptional 2.0% |
| Somalis | 99.2 /100 | #57 | Exceptional 2.0% |
| Immigrants | Saudi Arabia | 99.2 /100 | #58 | Exceptional 2.0% |
| Argentineans | 99.1 /100 | #59 | Exceptional 2.0% |
| Immigrants | Romania | 99.1 /100 | #60 | Exceptional 2.0% |
Demographics Similar to Germans by Vision Disability
In terms of vision disability, the demographic groups most similar to Germans are Immigrants from Nigeria (2.2%, a difference of 0.010%), Immigrants from Brazil (2.2%, a difference of 0.040%), Pennsylvania German (2.2%, a difference of 0.14%), Immigrants from Uruguay (2.2%, a difference of 0.27%), and Samoan (2.2%, a difference of 0.28%).
| Demographics | Rating | Rank | Vision Disability |
| Slovaks | 18.8 /100 | #201 | Poor 2.2% |
| Immigrants | Zaire | 18.0 /100 | #202 | Poor 2.2% |
| Dutch | 17.1 /100 | #203 | Poor 2.2% |
| Immigrants | Guyana | 15.9 /100 | #204 | Poor 2.2% |
| Samoans | 15.7 /100 | #205 | Poor 2.2% |
| Pennsylvania Germans | 14.5 /100 | #206 | Poor 2.2% |
| Immigrants | Nigeria | 13.5 /100 | #207 | Poor 2.2% |
| Germans | 13.4 /100 | #208 | Poor 2.2% |
| Immigrants | Brazil | 13.1 /100 | #209 | Poor 2.2% |
| Immigrants | Uruguay | 11.5 /100 | #210 | Poor 2.2% |
| Indonesians | 9.5 /100 | #211 | Tragic 2.2% |
| Bermudans | 9.0 /100 | #212 | Tragic 2.2% |
| Immigrants | Ghana | 8.9 /100 | #213 | Tragic 2.2% |
| Trinidadians and Tobagonians | 8.2 /100 | #214 | Tragic 2.2% |
| Nigerians | 7.2 /100 | #215 | Tragic 2.3% |