Immigrants from Barbados vs Immigrants from Ecuador Child Poverty Under the Age of 5
COMPARE
Immigrants from Barbados
Immigrants from Ecuador
Child Poverty Under the Age of 5
Child Poverty Under the Age of 5 Comparison
Immigrants from Barbados
Immigrants from Ecuador
20.0%
CHILD POVERTY UNDER THE AGE OF 5
0.2/ 100
METRIC RATING
256th/ 347
METRIC RANK
19.6%
CHILD POVERTY UNDER THE AGE OF 5
0.5/ 100
METRIC RATING
240th/ 347
METRIC RANK
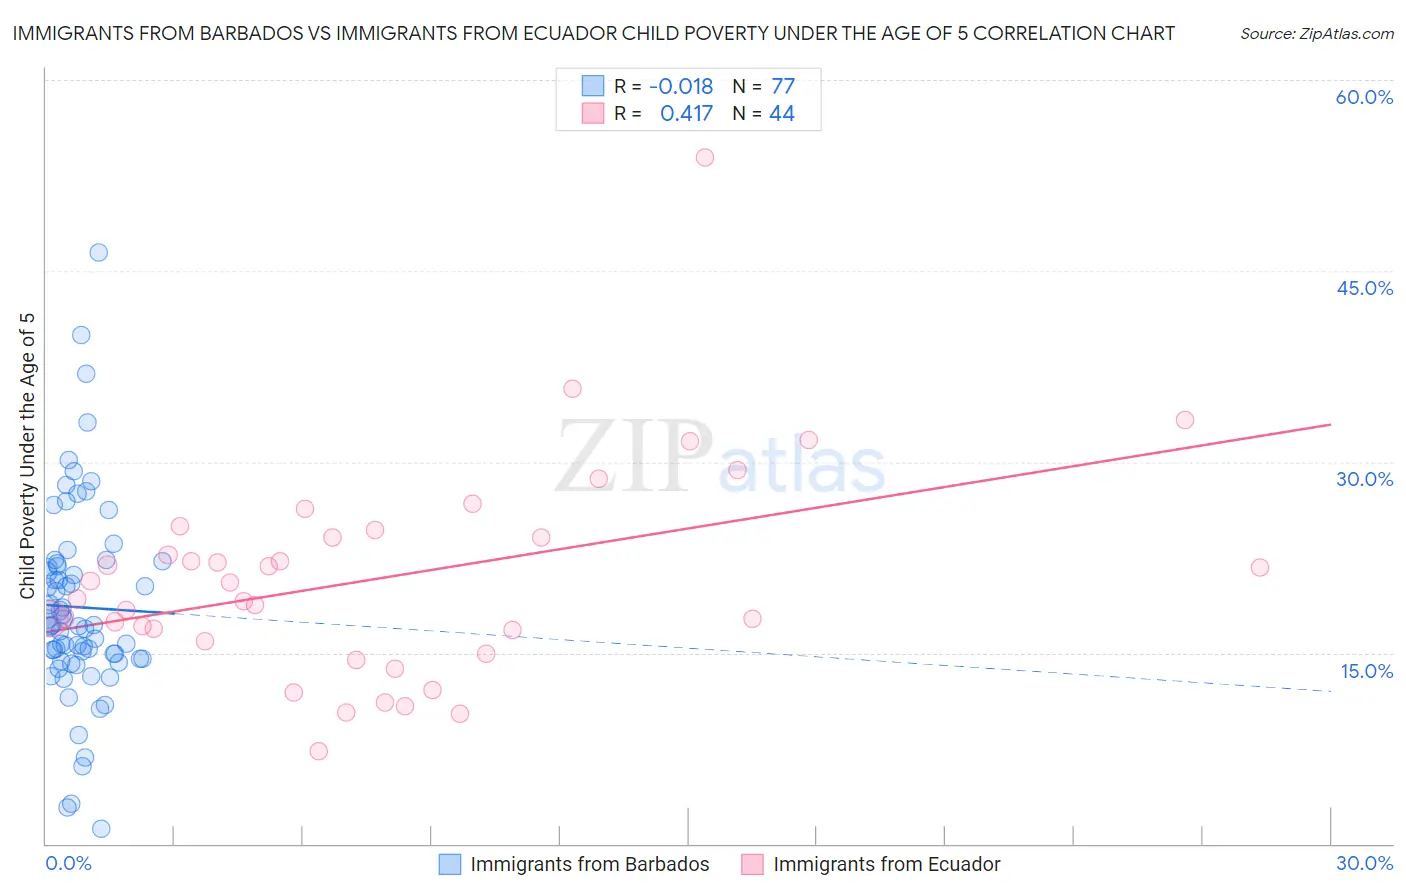
Immigrants from Barbados vs Immigrants from Ecuador Child Poverty Under the Age of 5 Correlation Chart
The statistical analysis conducted on geographies consisting of 111,157,881 people shows no correlation between the proportion of Immigrants from Barbados and poverty level among children under the age of 5 in the United States with a correlation coefficient (R) of -0.018 and weighted average of 20.0%. Similarly, the statistical analysis conducted on geographies consisting of 262,656,559 people shows a moderate positive correlation between the proportion of Immigrants from Ecuador and poverty level among children under the age of 5 in the United States with a correlation coefficient (R) of 0.417 and weighted average of 19.6%, a difference of 1.9%.
Child Poverty Under the Age of 5 Correlation Summary
| Measurement | Immigrants from Barbados | Immigrants from Ecuador |
| Minimum | 1.1% | 7.3% |
| Maximum | 46.4% | 53.9% |
| Range | 45.3% | 46.6% |
| Mean | 18.6% | 20.9% |
| Median | 17.1% | 19.9% |
| Interquartile 25% (IQ1) | 14.5% | 16.4% |
| Interquartile 75% (IQ3) | 21.9% | 24.4% |
| Interquartile Range (IQR) | 7.4% | 8.0% |
| Standard Deviation (Sample) | 7.7% | 8.3% |
| Standard Deviation (Population) | 7.6% | 8.2% |
Demographics Similar to Immigrants from Barbados and Immigrants from Ecuador by Child Poverty Under the Age of 5
In terms of child poverty under the age of 5, the demographic groups most similar to Immigrants from Barbados are Shoshone (20.0%, a difference of 0.010%), Immigrants from St. Vincent and the Grenadines (20.0%, a difference of 0.15%), Immigrants from Cuba (19.9%, a difference of 0.22%), Fijian (19.9%, a difference of 0.32%), and Mexican American Indian (19.9%, a difference of 0.47%). Similarly, the demographic groups most similar to Immigrants from Ecuador are Alaska Native (19.6%, a difference of 0.060%), Immigrants from Guyana (19.6%, a difference of 0.18%), Osage (19.6%, a difference of 0.28%), Immigrants from Ghana (19.6%, a difference of 0.30%), and Vietnamese (19.5%, a difference of 0.37%).
| Demographics | Rating | Rank | Child Poverty Under the Age of 5 |
| Salvadorans | 0.6 /100 | #238 | Tragic 19.5% |
| Vietnamese | 0.6 /100 | #239 | Tragic 19.5% |
| Immigrants | Ecuador | 0.5 /100 | #240 | Tragic 19.6% |
| Alaska Natives | 0.5 /100 | #241 | Tragic 19.6% |
| Immigrants | Guyana | 0.5 /100 | #242 | Tragic 19.6% |
| Osage | 0.5 /100 | #243 | Tragic 19.6% |
| Immigrants | Ghana | 0.5 /100 | #244 | Tragic 19.6% |
| Immigrants | Western Africa | 0.4 /100 | #245 | Tragic 19.7% |
| Cree | 0.4 /100 | #246 | Tragic 19.7% |
| Guyanese | 0.4 /100 | #247 | Tragic 19.7% |
| Marshallese | 0.4 /100 | #248 | Tragic 19.7% |
| Immigrants | Middle Africa | 0.4 /100 | #249 | Tragic 19.7% |
| Immigrants | Nonimmigrants | 0.4 /100 | #250 | Tragic 19.7% |
| Pennsylvania Germans | 0.3 /100 | #251 | Tragic 19.8% |
| Immigrants | Nicaragua | 0.3 /100 | #252 | Tragic 19.8% |
| Mexican American Indians | 0.3 /100 | #253 | Tragic 19.9% |
| Fijians | 0.3 /100 | #254 | Tragic 19.9% |
| Immigrants | Cuba | 0.2 /100 | #255 | Tragic 19.9% |
| Immigrants | Barbados | 0.2 /100 | #256 | Tragic 20.0% |
| Shoshone | 0.2 /100 | #257 | Tragic 20.0% |
| Immigrants | St. Vincent and the Grenadines | 0.2 /100 | #258 | Tragic 20.0% |