Immigrants from the Azores vs Sri Lankan Hearing Disability
COMPARE
Immigrants from the Azores
Sri Lankan
Hearing Disability
Hearing Disability Comparison
Immigrants from the Azores
Sri Lankans
3.7%
HEARING DISABILITY
0.0/ 100
METRIC RATING
297th/ 347
METRIC RANK
2.9%
HEARING DISABILITY
84.1/ 100
METRIC RATING
137th/ 347
METRIC RANK
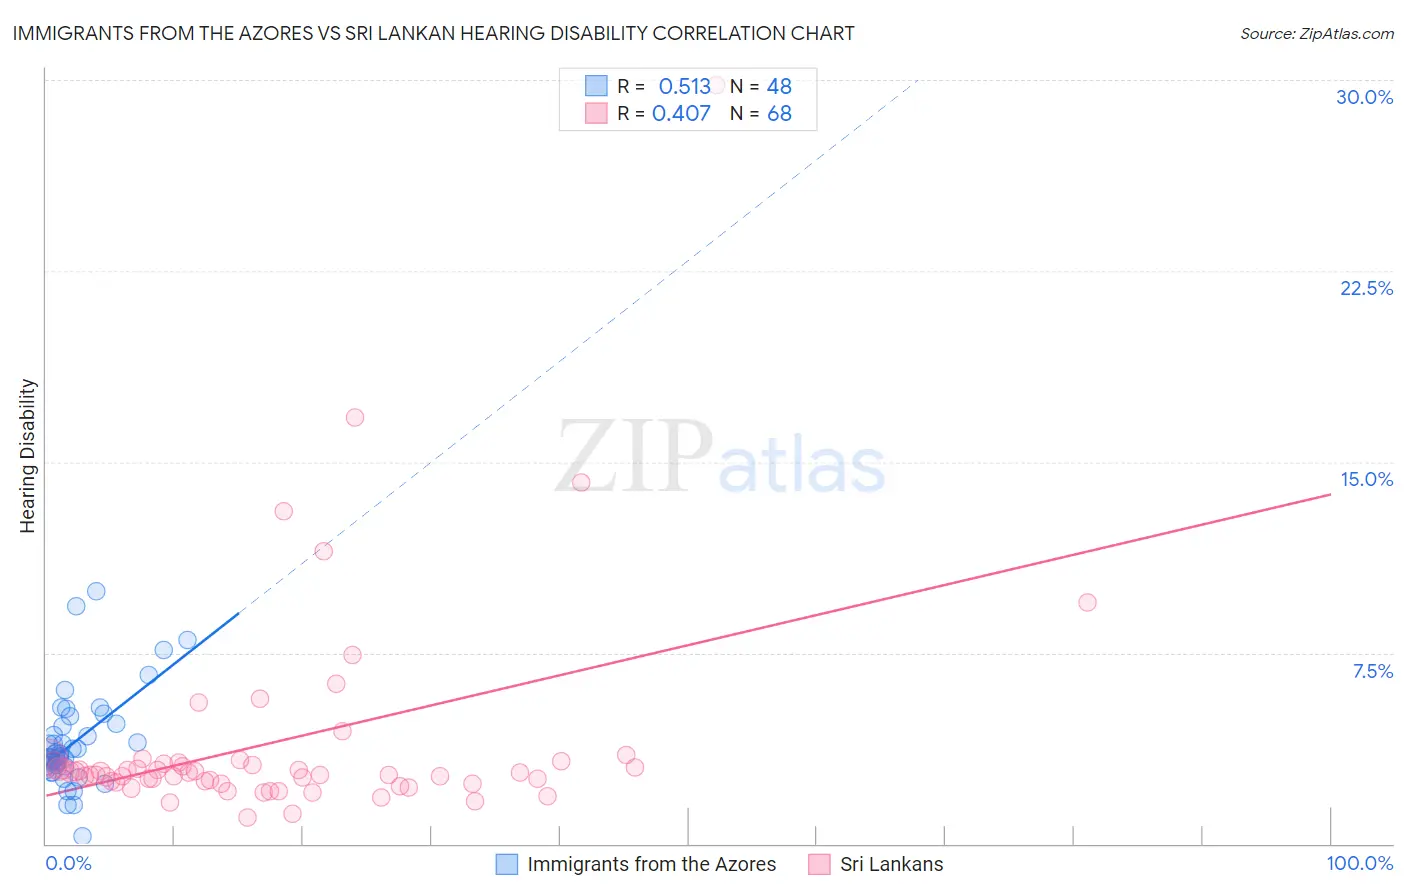
Immigrants from the Azores vs Sri Lankan Hearing Disability Correlation Chart
The statistical analysis conducted on geographies consisting of 46,255,123 people shows a substantial positive correlation between the proportion of Immigrants from the Azores and percentage of population with hearing disability in the United States with a correlation coefficient (R) of 0.513 and weighted average of 3.7%. Similarly, the statistical analysis conducted on geographies consisting of 440,283,716 people shows a moderate positive correlation between the proportion of Sri Lankans and percentage of population with hearing disability in the United States with a correlation coefficient (R) of 0.407 and weighted average of 2.9%, a difference of 29.1%.
Hearing Disability Correlation Summary
| Measurement | Immigrants from the Azores | Sri Lankan |
| Minimum | 0.28% | 1.0% |
| Maximum | 9.9% | 29.8% |
| Range | 9.6% | 28.7% |
| Mean | 4.0% | 4.0% |
| Median | 3.5% | 2.8% |
| Interquartile 25% (IQ1) | 3.1% | 2.4% |
| Interquartile 75% (IQ3) | 4.7% | 3.1% |
| Interquartile Range (IQR) | 1.6% | 0.71% |
| Standard Deviation (Sample) | 1.9% | 4.3% |
| Standard Deviation (Population) | 1.9% | 4.3% |
Similar Demographics by Hearing Disability
Demographics Similar to Immigrants from the Azores by Hearing Disability
In terms of hearing disability, the demographic groups most similar to Immigrants from the Azores are Pima (3.7%, a difference of 0.070%), Celtic (3.7%, a difference of 0.19%), Welsh (3.7%, a difference of 0.20%), Iroquois (3.7%, a difference of 0.46%), and German (3.7%, a difference of 0.47%).
| Demographics | Rating | Rank | Hearing Disability |
| Whites/Caucasians | 0.0 /100 | #290 | Tragic 3.7% |
| Finns | 0.0 /100 | #291 | Tragic 3.7% |
| Native Hawaiians | 0.0 /100 | #292 | Tragic 3.7% |
| Norwegians | 0.0 /100 | #293 | Tragic 3.7% |
| Iroquois | 0.0 /100 | #294 | Tragic 3.7% |
| Welsh | 0.0 /100 | #295 | Tragic 3.7% |
| Pima | 0.0 /100 | #296 | Tragic 3.7% |
| Immigrants | Azores | 0.0 /100 | #297 | Tragic 3.7% |
| Celtics | 0.0 /100 | #298 | Tragic 3.7% |
| Germans | 0.0 /100 | #299 | Tragic 3.7% |
| Scottish | 0.0 /100 | #300 | Tragic 3.7% |
| Pennsylvania Germans | 0.0 /100 | #301 | Tragic 3.7% |
| Dutch | 0.0 /100 | #302 | Tragic 3.7% |
| Menominee | 0.0 /100 | #303 | Tragic 3.7% |
| French | 0.0 /100 | #304 | Tragic 3.8% |
Demographics Similar to Sri Lankans by Hearing Disability
In terms of hearing disability, the demographic groups most similar to Sri Lankans are Immigrants from Costa Rica (2.9%, a difference of 0.010%), Bermudan (2.9%, a difference of 0.050%), Immigrants from Jordan (2.9%, a difference of 0.070%), Immigrants from Brazil (2.9%, a difference of 0.10%), and Soviet Union (2.9%, a difference of 0.13%).
| Demographics | Rating | Rank | Hearing Disability |
| Immigrants | Vietnam | 86.5 /100 | #130 | Excellent 2.9% |
| Immigrants | Kenya | 86.1 /100 | #131 | Excellent 2.9% |
| Chileans | 85.8 /100 | #132 | Excellent 2.9% |
| Immigrants | Syria | 85.8 /100 | #133 | Excellent 2.9% |
| Ugandans | 85.5 /100 | #134 | Excellent 2.9% |
| Soviet Union | 84.8 /100 | #135 | Excellent 2.9% |
| Immigrants | Brazil | 84.6 /100 | #136 | Excellent 2.9% |
| Sri Lankans | 84.1 /100 | #137 | Excellent 2.9% |
| Immigrants | Costa Rica | 84.0 /100 | #138 | Excellent 2.9% |
| Bermudans | 83.8 /100 | #139 | Excellent 2.9% |
| Immigrants | Jordan | 83.7 /100 | #140 | Excellent 2.9% |
| Sub-Saharan Africans | 83.3 /100 | #141 | Excellent 2.9% |
| Laotians | 81.1 /100 | #142 | Excellent 2.9% |
| Immigrants | Bahamas | 80.9 /100 | #143 | Excellent 2.9% |
| Immigrants | Bulgaria | 79.2 /100 | #144 | Good 2.9% |