Immigrants from the Azores vs Haitian Female Disability
COMPARE
Immigrants from the Azores
Haitian
Female Disability
Female Disability Comparison
Immigrants from the Azores
Haitians
14.9%
FEMALE DISABILITY
0.0/ 100
METRIC RATING
333rd/ 347
METRIC RANK
12.2%
FEMALE DISABILITY
51.9/ 100
METRIC RATING
172nd/ 347
METRIC RANK
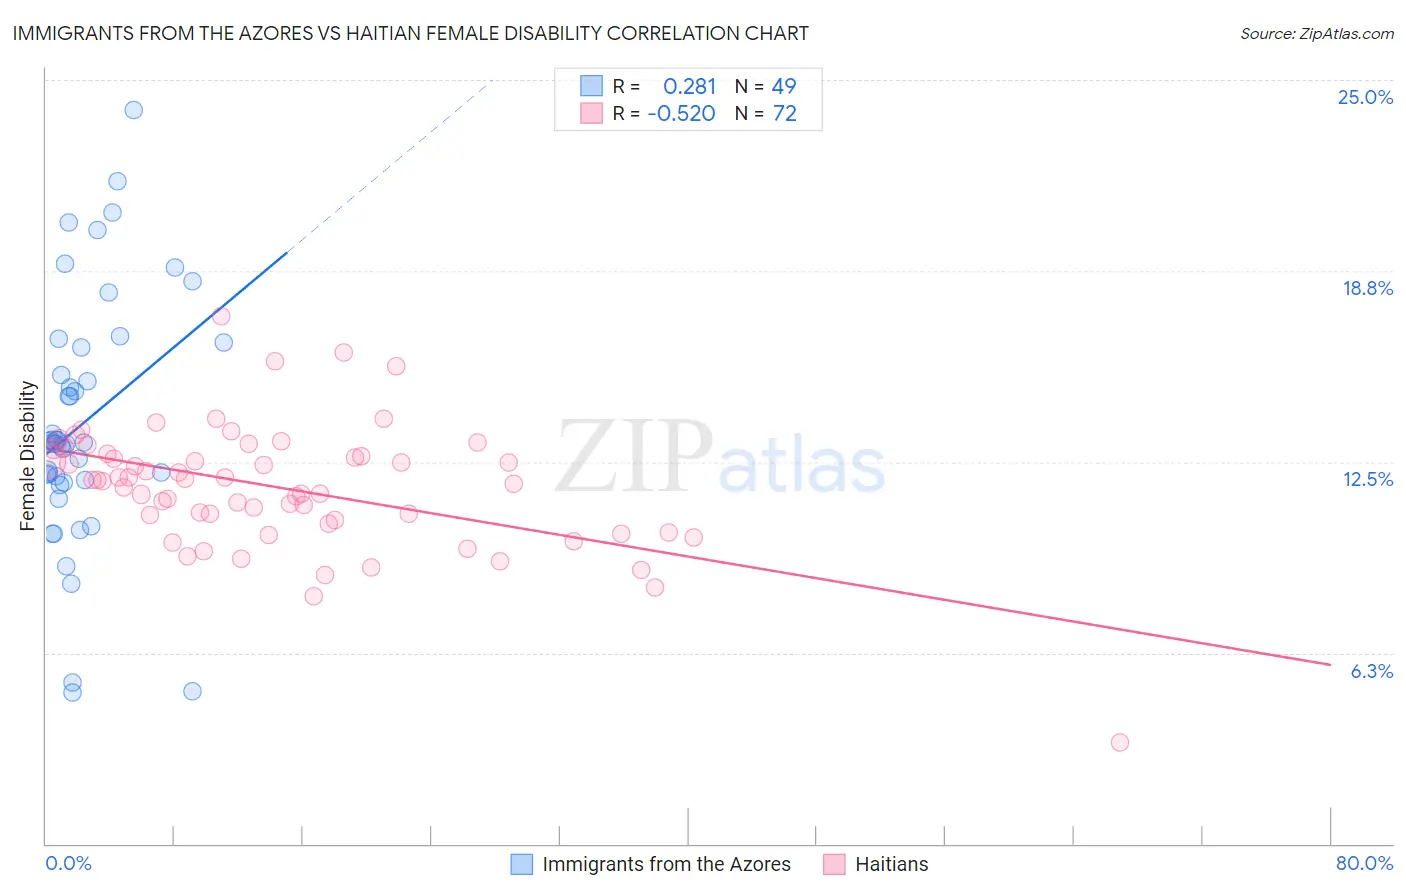
Immigrants from the Azores vs Haitian Female Disability Correlation Chart
The statistical analysis conducted on geographies consisting of 46,257,310 people shows a weak positive correlation between the proportion of Immigrants from the Azores and percentage of females with a disability in the United States with a correlation coefficient (R) of 0.281 and weighted average of 14.9%. Similarly, the statistical analysis conducted on geographies consisting of 287,924,181 people shows a substantial negative correlation between the proportion of Haitians and percentage of females with a disability in the United States with a correlation coefficient (R) of -0.520 and weighted average of 12.2%, a difference of 21.9%.
Female Disability Correlation Summary
| Measurement | Immigrants from the Azores | Haitian |
| Minimum | 5.0% | 3.3% |
| Maximum | 24.0% | 17.2% |
| Range | 19.1% | 13.9% |
| Mean | 13.8% | 11.6% |
| Median | 13.1% | 11.9% |
| Interquartile 25% (IQ1) | 11.9% | 10.5% |
| Interquartile 75% (IQ3) | 16.3% | 12.7% |
| Interquartile Range (IQR) | 4.5% | 2.2% |
| Standard Deviation (Sample) | 4.1% | 2.0% |
| Standard Deviation (Population) | 4.0% | 2.0% |
Similar Demographics by Female Disability
Demographics Similar to Immigrants from the Azores by Female Disability
In terms of female disability, the demographic groups most similar to Immigrants from the Azores are Cherokee (14.9%, a difference of 0.090%), Cajun (14.9%, a difference of 0.11%), Pima (14.8%, a difference of 0.39%), Seminole (15.0%, a difference of 0.79%), and Tohono O'odham (15.0%, a difference of 0.91%).
| Demographics | Rating | Rank | Female Disability |
| Comanche | 0.0 /100 | #326 | Tragic 14.2% |
| Ottawa | 0.0 /100 | #327 | Tragic 14.2% |
| Cape Verdeans | 0.0 /100 | #328 | Tragic 14.2% |
| Osage | 0.0 /100 | #329 | Tragic 14.3% |
| Yuman | 0.0 /100 | #330 | Tragic 14.5% |
| Immigrants | Cabo Verde | 0.0 /100 | #331 | Tragic 14.6% |
| Pima | 0.0 /100 | #332 | Tragic 14.8% |
| Immigrants | Azores | 0.0 /100 | #333 | Tragic 14.9% |
| Cherokee | 0.0 /100 | #334 | Tragic 14.9% |
| Cajuns | 0.0 /100 | #335 | Tragic 14.9% |
| Seminole | 0.0 /100 | #336 | Tragic 15.0% |
| Tohono O'odham | 0.0 /100 | #337 | Tragic 15.0% |
| Dutch West Indians | 0.0 /100 | #338 | Tragic 15.0% |
| Colville | 0.0 /100 | #339 | Tragic 15.1% |
| Chickasaw | 0.0 /100 | #340 | Tragic 15.2% |
Demographics Similar to Haitians by Female Disability
In terms of female disability, the demographic groups most similar to Haitians are Immigrants from Mexico (12.2%, a difference of 0.040%), Immigrants from England (12.2%, a difference of 0.070%), Immigrants from St. Vincent and the Grenadines (12.2%, a difference of 0.080%), Immigrants from Southern Europe (12.2%, a difference of 0.17%), and Maltese (12.2%, a difference of 0.19%).
| Demographics | Rating | Rank | Female Disability |
| Immigrants | Oceania | 61.8 /100 | #165 | Good 12.1% |
| Lithuanians | 59.5 /100 | #166 | Average 12.2% |
| Immigrants | Latin America | 59.0 /100 | #167 | Average 12.2% |
| Immigrants | Haiti | 58.8 /100 | #168 | Average 12.2% |
| Lebanese | 58.1 /100 | #169 | Average 12.2% |
| Maltese | 57.0 /100 | #170 | Average 12.2% |
| Immigrants | Southern Europe | 56.3 /100 | #171 | Average 12.2% |
| Haitians | 51.9 /100 | #172 | Average 12.2% |
| Immigrants | Mexico | 50.8 /100 | #173 | Average 12.2% |
| Immigrants | England | 50.0 /100 | #174 | Average 12.2% |
| Immigrants | St. Vincent and the Grenadines | 49.7 /100 | #175 | Average 12.2% |
| Immigrants | Guyana | 43.1 /100 | #176 | Average 12.2% |
| Immigrants | Ghana | 42.5 /100 | #177 | Average 12.2% |
| Immigrants | Western Europe | 40.9 /100 | #178 | Average 12.2% |
| Immigrants | Fiji | 38.2 /100 | #179 | Fair 12.3% |