Immigrants from Austria vs Menominee Self-Care Disability
COMPARE
Immigrants from Austria
Menominee
Self-Care Disability
Self-Care Disability Comparison
Immigrants from Austria
Menominee
2.4%
SELF-CARE DISABILITY
89.0/ 100
METRIC RATING
130th/ 347
METRIC RANK
2.8%
SELF-CARE DISABILITY
0.0/ 100
METRIC RATING
316th/ 347
METRIC RANK
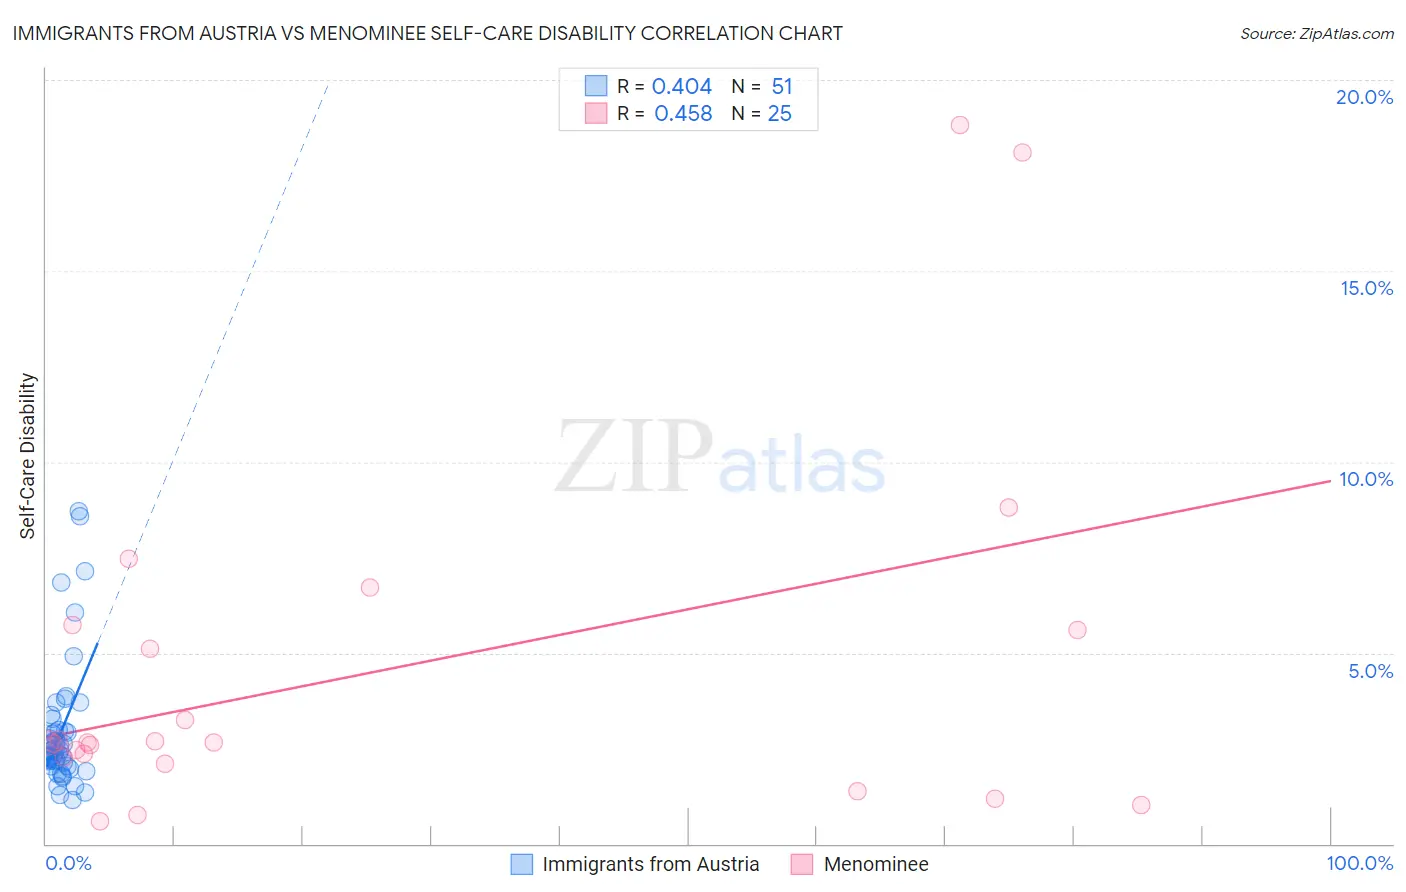
Immigrants from Austria vs Menominee Self-Care Disability Correlation Chart
The statistical analysis conducted on geographies consisting of 167,909,652 people shows a moderate positive correlation between the proportion of Immigrants from Austria and percentage of population with self-care disability in the United States with a correlation coefficient (R) of 0.404 and weighted average of 2.4%. Similarly, the statistical analysis conducted on geographies consisting of 45,776,619 people shows a moderate positive correlation between the proportion of Menominee and percentage of population with self-care disability in the United States with a correlation coefficient (R) of 0.458 and weighted average of 2.8%, a difference of 18.3%.
Self-Care Disability Correlation Summary
| Measurement | Immigrants from Austria | Menominee |
| Minimum | 1.1% | 0.59% |
| Maximum | 8.7% | 18.8% |
| Range | 7.6% | 18.2% |
| Mean | 3.0% | 4.5% |
| Median | 2.4% | 2.6% |
| Interquartile 25% (IQ1) | 2.0% | 2.2% |
| Interquartile 75% (IQ3) | 3.0% | 5.7% |
| Interquartile Range (IQR) | 0.94% | 3.5% |
| Standard Deviation (Sample) | 1.7% | 4.7% |
| Standard Deviation (Population) | 1.7% | 4.6% |
Similar Demographics by Self-Care Disability
Demographics Similar to Immigrants from Austria by Self-Care Disability
In terms of self-care disability, the demographic groups most similar to Immigrants from Austria are Polish (2.4%, a difference of 0.020%), Immigrants from Romania (2.4%, a difference of 0.030%), Immigrants from South America (2.4%, a difference of 0.030%), Immigrants from Colombia (2.4%, a difference of 0.060%), and Colombian (2.4%, a difference of 0.080%).
| Demographics | Rating | Rank | Self-Care Disability |
| Immigrants | Nigeria | 90.3 /100 | #123 | Exceptional 2.4% |
| Immigrants | Morocco | 90.2 /100 | #124 | Exceptional 2.4% |
| Immigrants | North America | 90.2 /100 | #124 | Exceptional 2.4% |
| Hmong | 89.9 /100 | #126 | Excellent 2.4% |
| Colombians | 89.7 /100 | #127 | Excellent 2.4% |
| Immigrants | Hungary | 89.6 /100 | #128 | Excellent 2.4% |
| Immigrants | Romania | 89.3 /100 | #129 | Excellent 2.4% |
| Immigrants | Austria | 89.0 /100 | #130 | Excellent 2.4% |
| Poles | 88.9 /100 | #131 | Excellent 2.4% |
| Immigrants | South America | 88.8 /100 | #132 | Excellent 2.4% |
| Immigrants | Colombia | 88.5 /100 | #133 | Excellent 2.4% |
| Russians | 88.2 /100 | #134 | Excellent 2.4% |
| Laotians | 87.8 /100 | #135 | Excellent 2.4% |
| South American Indians | 87.2 /100 | #136 | Excellent 2.4% |
| Austrians | 87.0 /100 | #137 | Excellent 2.4% |
Demographics Similar to Menominee by Self-Care Disability
In terms of self-care disability, the demographic groups most similar to Menominee are Immigrants from Cuba (2.8%, a difference of 0.10%), Immigrants from Dominica (2.8%, a difference of 0.13%), Assyrian/Chaldean/Syriac (2.8%, a difference of 0.14%), Spanish American Indian (2.9%, a difference of 0.29%), and Creek (2.8%, a difference of 0.32%).
| Demographics | Rating | Rank | Self-Care Disability |
| Bangladeshis | 0.0 /100 | #309 | Tragic 2.8% |
| British West Indians | 0.0 /100 | #310 | Tragic 2.8% |
| Puget Sound Salish | 0.0 /100 | #311 | Tragic 2.8% |
| Immigrants | Caribbean | 0.0 /100 | #312 | Tragic 2.8% |
| Spanish Americans | 0.0 /100 | #313 | Tragic 2.8% |
| Creek | 0.0 /100 | #314 | Tragic 2.8% |
| Immigrants | Cuba | 0.0 /100 | #315 | Tragic 2.8% |
| Menominee | 0.0 /100 | #316 | Tragic 2.8% |
| Immigrants | Dominica | 0.0 /100 | #317 | Tragic 2.8% |
| Assyrians/Chaldeans/Syriacs | 0.0 /100 | #318 | Tragic 2.8% |
| Spanish American Indians | 0.0 /100 | #319 | Tragic 2.9% |
| Chickasaw | 0.0 /100 | #320 | Tragic 2.9% |
| Navajo | 0.0 /100 | #321 | Tragic 2.9% |
| Comanche | 0.0 /100 | #322 | Tragic 2.9% |
| Seminole | 0.0 /100 | #323 | Tragic 2.9% |