Immigrants from Austria vs Hmong Hearing Disability
COMPARE
Immigrants from Austria
Hmong
Hearing Disability
Hearing Disability Comparison
Immigrants from Austria
Hmong
3.3%
HEARING DISABILITY
1.8/ 100
METRIC RATING
237th/ 347
METRIC RANK
3.4%
HEARING DISABILITY
0.2/ 100
METRIC RATING
256th/ 347
METRIC RANK
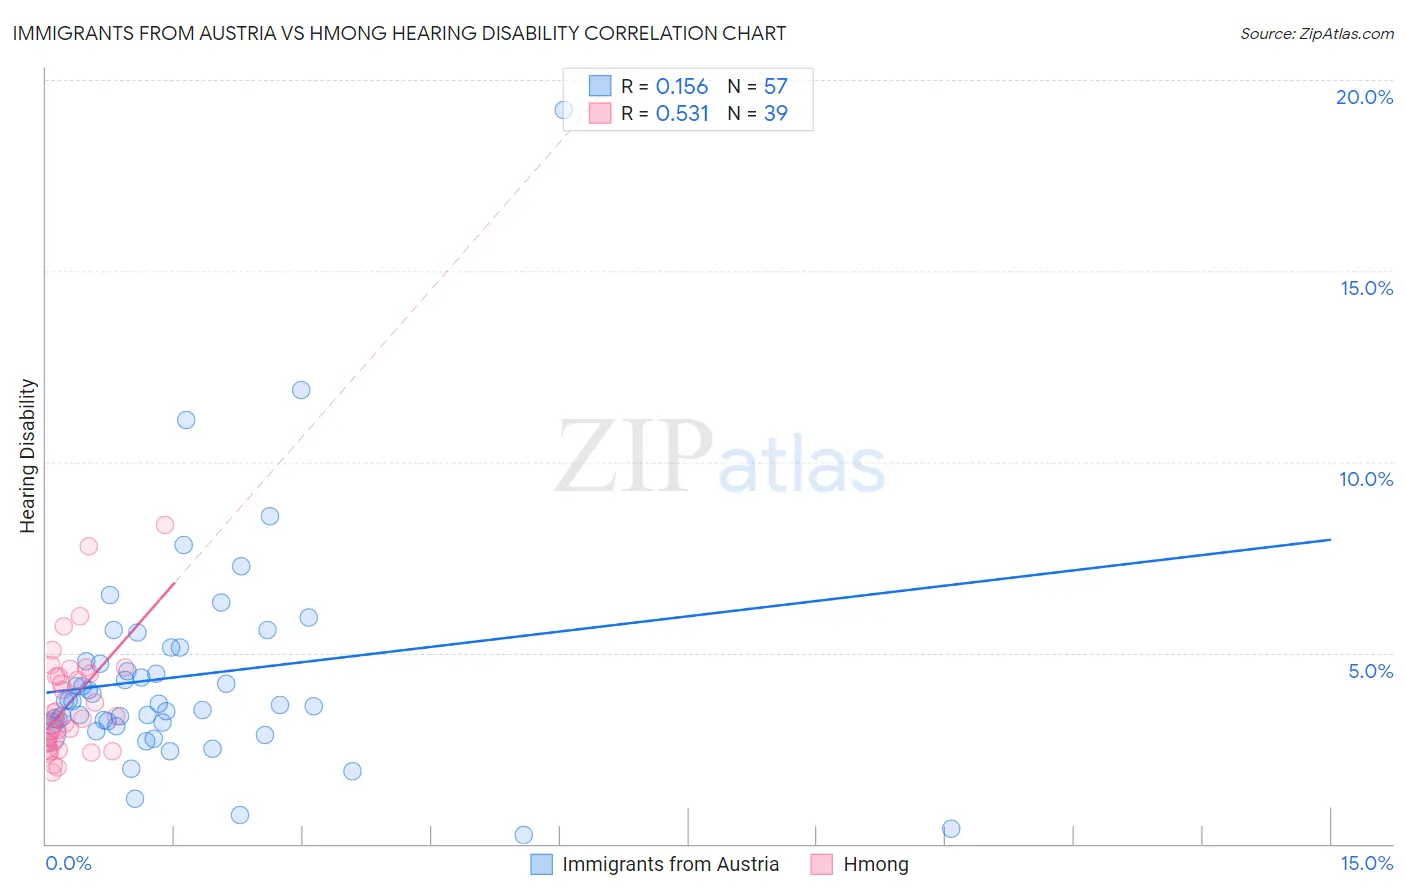
Immigrants from Austria vs Hmong Hearing Disability Correlation Chart
The statistical analysis conducted on geographies consisting of 167,968,666 people shows a poor positive correlation between the proportion of Immigrants from Austria and percentage of population with hearing disability in the United States with a correlation coefficient (R) of 0.156 and weighted average of 3.3%. Similarly, the statistical analysis conducted on geographies consisting of 24,680,511 people shows a substantial positive correlation between the proportion of Hmong and percentage of population with hearing disability in the United States with a correlation coefficient (R) of 0.531 and weighted average of 3.4%, a difference of 4.7%.
Hearing Disability Correlation Summary
| Measurement | Immigrants from Austria | Hmong |
| Minimum | 0.21% | 1.9% |
| Maximum | 19.2% | 8.3% |
| Range | 19.0% | 6.5% |
| Mean | 4.4% | 3.7% |
| Median | 3.7% | 3.3% |
| Interquartile 25% (IQ1) | 3.1% | 2.6% |
| Interquartile 75% (IQ3) | 5.0% | 4.5% |
| Interquartile Range (IQR) | 1.9% | 1.8% |
| Standard Deviation (Sample) | 2.9% | 1.5% |
| Standard Deviation (Population) | 2.9% | 1.4% |
Demographics Similar to Immigrants from Austria and Hmong by Hearing Disability
In terms of hearing disability, the demographic groups most similar to Immigrants from Austria are German Russian (3.3%, a difference of 0.0%), Serbian (3.3%, a difference of 0.39%), Nepalese (3.3%, a difference of 0.87%), Immigrants from Netherlands (3.3%, a difference of 1.1%), and Samoan (3.3%, a difference of 1.1%). Similarly, the demographic groups most similar to Hmong are Polish (3.4%, a difference of 0.040%), Slavic (3.4%, a difference of 0.27%), Carpatho Rusyn (3.4%, a difference of 0.70%), Croatian (3.4%, a difference of 1.1%), and Hungarian (3.4%, a difference of 1.4%).
| Demographics | Rating | Rank | Hearing Disability |
| Serbians | 2.2 /100 | #236 | Tragic 3.3% |
| Immigrants | Austria | 1.8 /100 | #237 | Tragic 3.3% |
| German Russians | 1.8 /100 | #238 | Tragic 3.3% |
| Nepalese | 1.2 /100 | #239 | Tragic 3.3% |
| Immigrants | Netherlands | 1.1 /100 | #240 | Tragic 3.3% |
| Samoans | 1.1 /100 | #241 | Tragic 3.3% |
| Yugoslavians | 1.0 /100 | #242 | Tragic 3.3% |
| Immigrants | Western Europe | 1.0 /100 | #243 | Tragic 3.3% |
| Assyrians/Chaldeans/Syriacs | 0.9 /100 | #244 | Tragic 3.3% |
| Immigrants | Scotland | 0.8 /100 | #245 | Tragic 3.3% |
| Immigrants | England | 0.7 /100 | #246 | Tragic 3.3% |
| Lithuanians | 0.6 /100 | #247 | Tragic 3.4% |
| Austrians | 0.6 /100 | #248 | Tragic 3.4% |
| Italians | 0.4 /100 | #249 | Tragic 3.4% |
| Yuman | 0.4 /100 | #250 | Tragic 3.4% |
| Hungarians | 0.4 /100 | #251 | Tragic 3.4% |
| Croatians | 0.4 /100 | #252 | Tragic 3.4% |
| Carpatho Rusyns | 0.3 /100 | #253 | Tragic 3.4% |
| Slavs | 0.2 /100 | #254 | Tragic 3.4% |
| Poles | 0.2 /100 | #255 | Tragic 3.4% |
| Hmong | 0.2 /100 | #256 | Tragic 3.4% |