Immigrants from Austria vs Immigrants from Egypt Hearing Disability
COMPARE
Immigrants from Austria
Immigrants from Egypt
Hearing Disability
Hearing Disability Comparison
Immigrants from Austria
Immigrants from Egypt
3.3%
HEARING DISABILITY
1.8/ 100
METRIC RATING
237th/ 347
METRIC RANK
2.7%
HEARING DISABILITY
98.5/ 100
METRIC RATING
60th/ 347
METRIC RANK
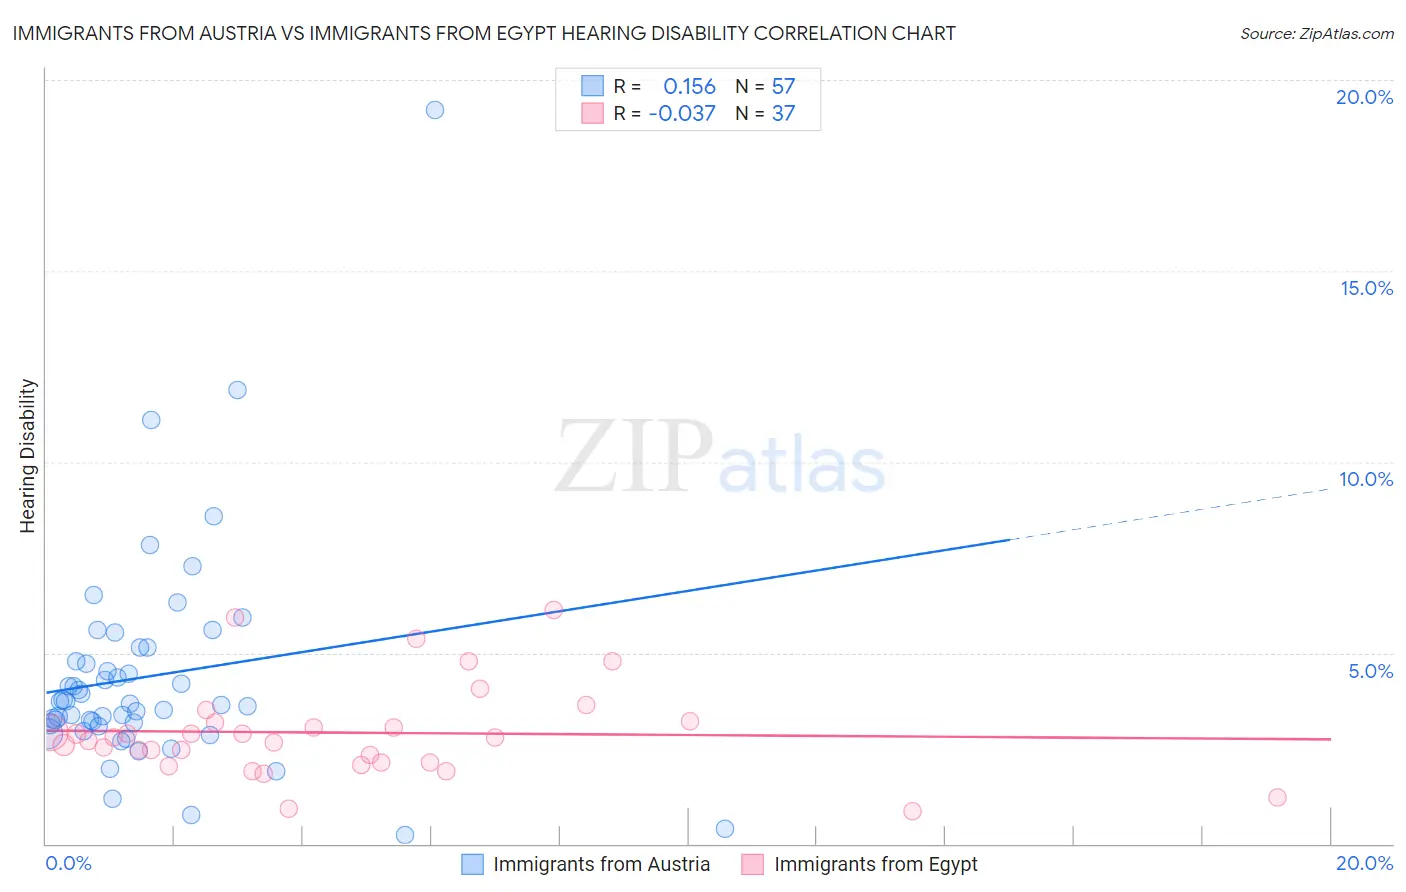
Immigrants from Austria vs Immigrants from Egypt Hearing Disability Correlation Chart
The statistical analysis conducted on geographies consisting of 167,968,666 people shows a poor positive correlation between the proportion of Immigrants from Austria and percentage of population with hearing disability in the United States with a correlation coefficient (R) of 0.156 and weighted average of 3.3%. Similarly, the statistical analysis conducted on geographies consisting of 245,432,770 people shows no correlation between the proportion of Immigrants from Egypt and percentage of population with hearing disability in the United States with a correlation coefficient (R) of -0.037 and weighted average of 2.7%, a difference of 21.3%.
Hearing Disability Correlation Summary
| Measurement | Immigrants from Austria | Immigrants from Egypt |
| Minimum | 0.21% | 0.86% |
| Maximum | 19.2% | 6.1% |
| Range | 19.0% | 5.3% |
| Mean | 4.4% | 2.9% |
| Median | 3.7% | 2.8% |
| Interquartile 25% (IQ1) | 3.1% | 2.1% |
| Interquartile 75% (IQ3) | 5.0% | 3.2% |
| Interquartile Range (IQR) | 1.9% | 1.1% |
| Standard Deviation (Sample) | 2.9% | 1.2% |
| Standard Deviation (Population) | 2.9% | 1.2% |
Similar Demographics by Hearing Disability
Demographics Similar to Immigrants from Austria by Hearing Disability
In terms of hearing disability, the demographic groups most similar to Immigrants from Austria are German Russian (3.3%, a difference of 0.0%), Serbian (3.3%, a difference of 0.39%), Guamanian/Chamorro (3.3%, a difference of 0.46%), Central American Indian (3.3%, a difference of 0.56%), and Estonian (3.3%, a difference of 0.63%).
| Demographics | Rating | Rank | Hearing Disability |
| Greeks | 3.2 /100 | #230 | Tragic 3.2% |
| Luxembourgers | 2.9 /100 | #231 | Tragic 3.2% |
| Ukrainians | 2.9 /100 | #232 | Tragic 3.2% |
| Estonians | 2.4 /100 | #233 | Tragic 3.3% |
| Central American Indians | 2.3 /100 | #234 | Tragic 3.3% |
| Guamanians/Chamorros | 2.2 /100 | #235 | Tragic 3.3% |
| Serbians | 2.2 /100 | #236 | Tragic 3.3% |
| Immigrants | Austria | 1.8 /100 | #237 | Tragic 3.3% |
| German Russians | 1.8 /100 | #238 | Tragic 3.3% |
| Nepalese | 1.2 /100 | #239 | Tragic 3.3% |
| Immigrants | Netherlands | 1.1 /100 | #240 | Tragic 3.3% |
| Samoans | 1.1 /100 | #241 | Tragic 3.3% |
| Yugoslavians | 1.0 /100 | #242 | Tragic 3.3% |
| Immigrants | Western Europe | 1.0 /100 | #243 | Tragic 3.3% |
| Assyrians/Chaldeans/Syriacs | 0.9 /100 | #244 | Tragic 3.3% |
Demographics Similar to Immigrants from Egypt by Hearing Disability
In terms of hearing disability, the demographic groups most similar to Immigrants from Egypt are Immigrants from Eritrea (2.7%, a difference of 0.070%), Immigrants from Uzbekistan (2.7%, a difference of 0.13%), Immigrants from Colombia (2.7%, a difference of 0.14%), Immigrants from Peru (2.7%, a difference of 0.18%), and Indian (Asian) (2.7%, a difference of 0.19%).
| Demographics | Rating | Rank | Hearing Disability |
| Immigrants | Eastern Asia | 99.0 /100 | #53 | Exceptional 2.7% |
| Ethiopians | 99.0 /100 | #54 | Exceptional 2.7% |
| Immigrants | Ethiopia | 99.0 /100 | #55 | Exceptional 2.7% |
| Immigrants | Nicaragua | 99.0 /100 | #56 | Exceptional 2.7% |
| South Americans | 99.0 /100 | #57 | Exceptional 2.7% |
| Immigrants | Peru | 98.6 /100 | #58 | Exceptional 2.7% |
| Immigrants | Eritrea | 98.5 /100 | #59 | Exceptional 2.7% |
| Immigrants | Egypt | 98.5 /100 | #60 | Exceptional 2.7% |
| Immigrants | Uzbekistan | 98.4 /100 | #61 | Exceptional 2.7% |
| Immigrants | Colombia | 98.4 /100 | #62 | Exceptional 2.7% |
| Indians (Asian) | 98.4 /100 | #63 | Exceptional 2.7% |
| Immigrants | Sri Lanka | 98.4 /100 | #64 | Exceptional 2.7% |
| Immigrants | Nepal | 98.3 /100 | #65 | Exceptional 2.7% |
| Immigrants | Belize | 98.2 /100 | #66 | Exceptional 2.7% |
| Egyptians | 98.1 /100 | #67 | Exceptional 2.7% |