Immigrants from Indonesia vs Immigrants from Barbados Disability Age 5 to 17
COMPARE
Immigrants from Indonesia
Immigrants from Barbados
Disability Age 5 to 17
Disability Age 5 to 17 Comparison
Immigrants from Indonesia
Immigrants from Barbados
5.0%
DISABILITY AGE 5 TO 17
100.0/ 100
METRIC RATING
33rd/ 347
METRIC RANK
5.6%
DISABILITY AGE 5 TO 17
40.5/ 100
METRIC RATING
179th/ 347
METRIC RANK
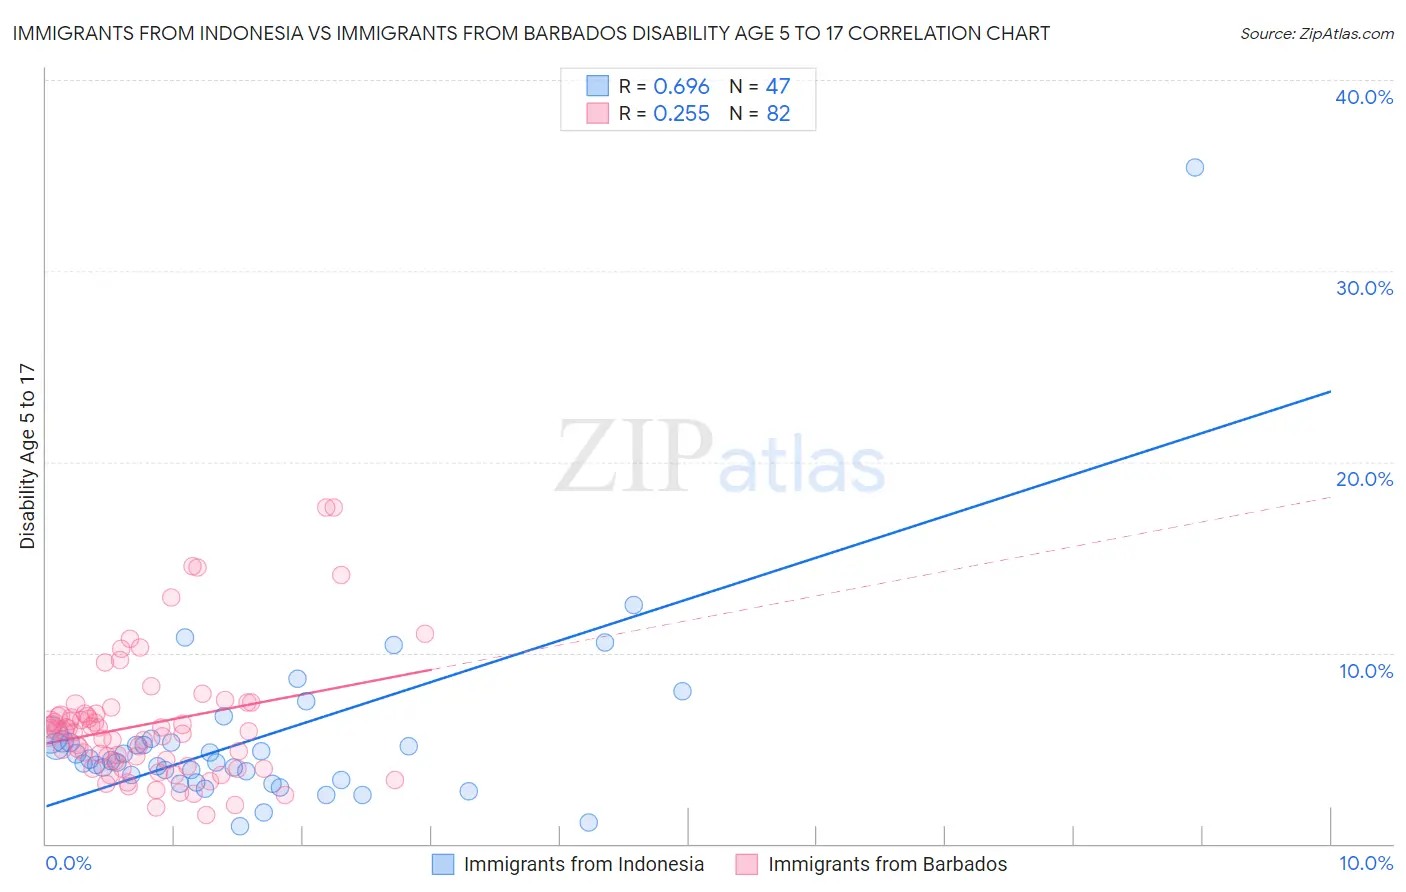
Immigrants from Indonesia vs Immigrants from Barbados Disability Age 5 to 17 Correlation Chart
The statistical analysis conducted on geographies consisting of 214,816,459 people shows a significant positive correlation between the proportion of Immigrants from Indonesia and percentage of population with a disability between the ages 5 and 17 in the United States with a correlation coefficient (R) of 0.696 and weighted average of 5.0%. Similarly, the statistical analysis conducted on geographies consisting of 112,576,995 people shows a weak positive correlation between the proportion of Immigrants from Barbados and percentage of population with a disability between the ages 5 and 17 in the United States with a correlation coefficient (R) of 0.255 and weighted average of 5.6%, a difference of 12.8%.
Disability Age 5 to 17 Correlation Summary
| Measurement | Immigrants from Indonesia | Immigrants from Barbados |
| Minimum | 0.90% | 1.5% |
| Maximum | 35.4% | 17.6% |
| Range | 34.5% | 16.1% |
| Mean | 5.5% | 6.3% |
| Median | 4.4% | 5.9% |
| Interquartile 25% (IQ1) | 3.3% | 4.1% |
| Interquartile 75% (IQ3) | 5.4% | 6.8% |
| Interquartile Range (IQR) | 2.0% | 2.7% |
| Standard Deviation (Sample) | 5.1% | 3.2% |
| Standard Deviation (Population) | 5.0% | 3.2% |
Similar Demographics by Disability Age 5 to 17
Demographics Similar to Immigrants from Indonesia by Disability Age 5 to 17
In terms of disability age 5 to 17, the demographic groups most similar to Immigrants from Indonesia are Israeli (5.0%, a difference of 0.12%), Bolivian (5.0%, a difference of 0.30%), Soviet Union (5.0%, a difference of 0.32%), Immigrants from Egypt (5.0%, a difference of 0.35%), and Immigrants from Pakistan (5.0%, a difference of 0.36%).
| Demographics | Rating | Rank | Disability Age 5 to 17 |
| Bhutanese | 100.0 /100 | #26 | Exceptional 4.9% |
| Taiwanese | 100.0 /100 | #27 | Exceptional 4.9% |
| Immigrants | Japan | 100.0 /100 | #28 | Exceptional 4.9% |
| Immigrants | Serbia | 100.0 /100 | #29 | Exceptional 4.9% |
| Immigrants | Malaysia | 100.0 /100 | #30 | Exceptional 5.0% |
| Immigrants | Pakistan | 100.0 /100 | #31 | Exceptional 5.0% |
| Soviet Union | 100.0 /100 | #32 | Exceptional 5.0% |
| Immigrants | Indonesia | 100.0 /100 | #33 | Exceptional 5.0% |
| Israelis | 100.0 /100 | #34 | Exceptional 5.0% |
| Bolivians | 100.0 /100 | #35 | Exceptional 5.0% |
| Immigrants | Egypt | 100.0 /100 | #36 | Exceptional 5.0% |
| Immigrants | Belarus | 100.0 /100 | #37 | Exceptional 5.0% |
| Immigrants | Philippines | 100.0 /100 | #38 | Exceptional 5.0% |
| Immigrants | Argentina | 100.0 /100 | #39 | Exceptional 5.0% |
| Okinawans | 100.0 /100 | #40 | Exceptional 5.0% |
Demographics Similar to Immigrants from Barbados by Disability Age 5 to 17
In terms of disability age 5 to 17, the demographic groups most similar to Immigrants from Barbados are Immigrants from Uruguay (5.6%, a difference of 0.14%), Immigrants from England (5.6%, a difference of 0.21%), Mexican American Indian (5.6%, a difference of 0.27%), Immigrants from Latin America (5.6%, a difference of 0.32%), and Syrian (5.6%, a difference of 0.35%).
| Demographics | Rating | Rank | Disability Age 5 to 17 |
| Ukrainians | 51.5 /100 | #172 | Average 5.6% |
| Uruguayans | 51.0 /100 | #173 | Average 5.6% |
| Costa Ricans | 50.0 /100 | #174 | Average 5.6% |
| Shoshone | 49.4 /100 | #175 | Average 5.6% |
| Immigrants | Central America | 49.4 /100 | #176 | Average 5.6% |
| Immigrants | Western Europe | 47.8 /100 | #177 | Average 5.6% |
| Immigrants | Trinidad and Tobago | 47.6 /100 | #178 | Average 5.6% |
| Immigrants | Barbados | 40.5 /100 | #179 | Average 5.6% |
| Immigrants | Uruguay | 37.7 /100 | #180 | Fair 5.6% |
| Immigrants | England | 36.4 /100 | #181 | Fair 5.6% |
| Mexican American Indians | 35.2 /100 | #182 | Fair 5.6% |
| Immigrants | Latin America | 34.3 /100 | #183 | Fair 5.6% |
| Syrians | 33.8 /100 | #184 | Fair 5.6% |
| Immigrants | Mexico | 33.7 /100 | #185 | Fair 5.6% |
| Fijians | 31.7 /100 | #186 | Fair 5.7% |