Immigrants from Australia vs Yuman Single Father Households
COMPARE
Immigrants from Australia
Yuman
Single Father Households
Single Father Households Comparison
Immigrants from Australia
Yuman
2.0%
SINGLE FATHER HOUSEHOLDS
100.0/ 100
METRIC RATING
34th/ 347
METRIC RANK
3.3%
SINGLE FATHER HOUSEHOLDS
0.0/ 100
METRIC RATING
334th/ 347
METRIC RANK
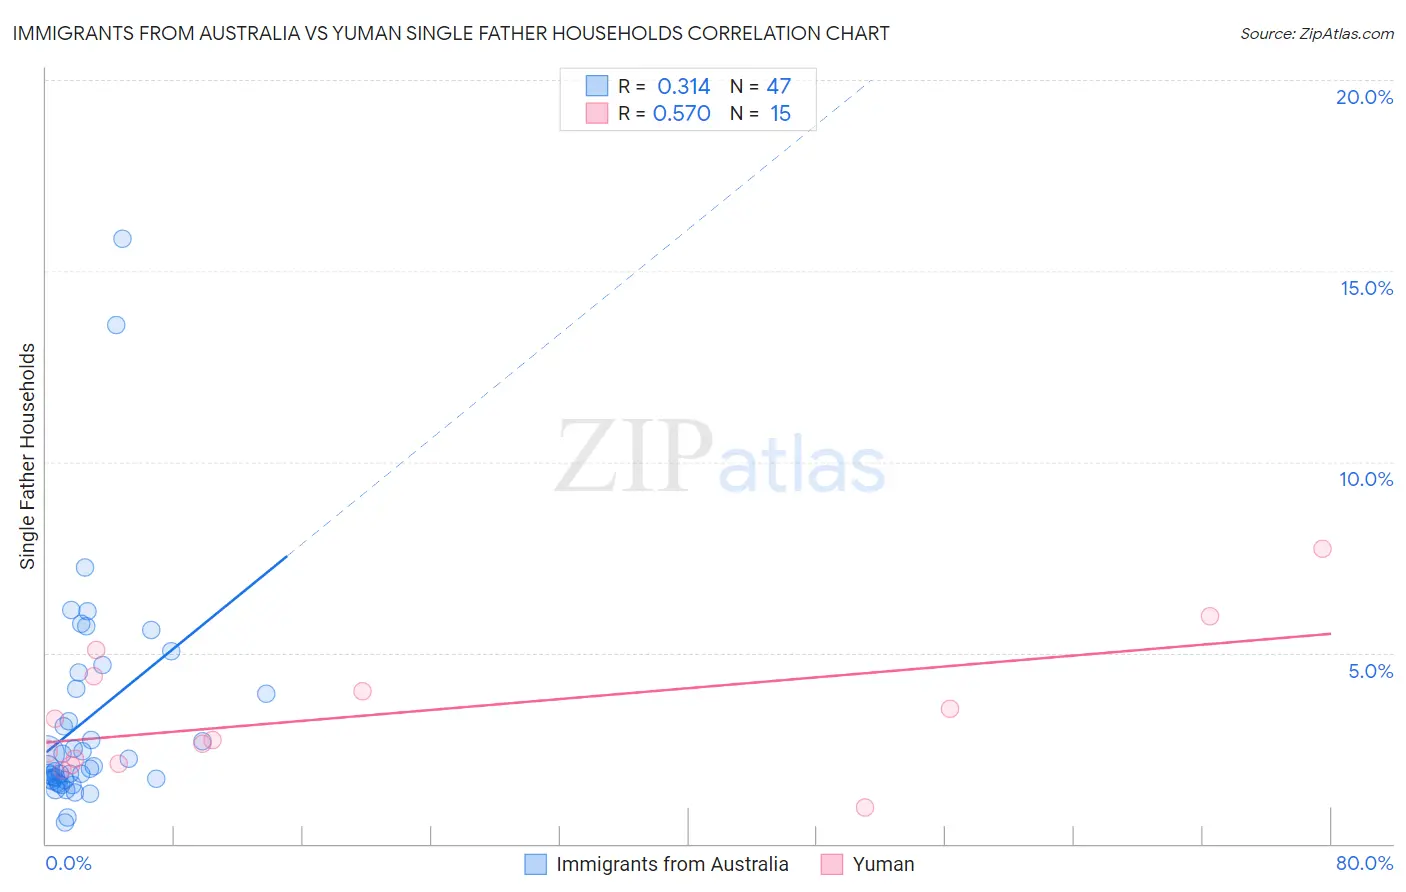
Immigrants from Australia vs Yuman Single Father Households Correlation Chart
The statistical analysis conducted on geographies consisting of 225,821,838 people shows a mild positive correlation between the proportion of Immigrants from Australia and percentage of single father households in the United States with a correlation coefficient (R) of 0.314 and weighted average of 2.0%. Similarly, the statistical analysis conducted on geographies consisting of 40,610,556 people shows a substantial positive correlation between the proportion of Yuman and percentage of single father households in the United States with a correlation coefficient (R) of 0.570 and weighted average of 3.3%, a difference of 66.7%.
Single Father Households Correlation Summary
| Measurement | Immigrants from Australia | Yuman |
| Minimum | 0.57% | 0.94% |
| Maximum | 15.8% | 7.7% |
| Range | 15.3% | 6.8% |
| Mean | 3.2% | 3.4% |
| Median | 2.0% | 2.7% |
| Interquartile 25% (IQ1) | 1.7% | 2.1% |
| Interquartile 75% (IQ3) | 4.1% | 4.4% |
| Interquartile Range (IQR) | 2.4% | 2.3% |
| Standard Deviation (Sample) | 2.9% | 1.8% |
| Standard Deviation (Population) | 2.9% | 1.7% |
Similar Demographics by Single Father Households
Demographics Similar to Immigrants from Australia by Single Father Households
In terms of single father households, the demographic groups most similar to Immigrants from Australia are Turkish (2.0%, a difference of 0.020%), Chinese (2.0%, a difference of 0.23%), Israeli (2.0%, a difference of 0.28%), Cambodian (2.0%, a difference of 0.31%), and Albanian (2.0%, a difference of 0.32%).
| Demographics | Rating | Rank | Single Father Households |
| Immigrants | South Central Asia | 100.0 /100 | #27 | Exceptional 2.0% |
| Immigrants | Japan | 100.0 /100 | #28 | Exceptional 2.0% |
| Bulgarians | 100.0 /100 | #29 | Exceptional 2.0% |
| Cambodians | 100.0 /100 | #30 | Exceptional 2.0% |
| Israelis | 100.0 /100 | #31 | Exceptional 2.0% |
| Chinese | 100.0 /100 | #32 | Exceptional 2.0% |
| Turks | 100.0 /100 | #33 | Exceptional 2.0% |
| Immigrants | Australia | 100.0 /100 | #34 | Exceptional 2.0% |
| Albanians | 100.0 /100 | #35 | Exceptional 2.0% |
| Immigrants | Belgium | 100.0 /100 | #36 | Exceptional 2.0% |
| Immigrants | St. Vincent and the Grenadines | 100.0 /100 | #37 | Exceptional 2.0% |
| Immigrants | Eastern Europe | 100.0 /100 | #38 | Exceptional 2.0% |
| Immigrants | Sri Lanka | 100.0 /100 | #39 | Exceptional 2.0% |
| Immigrants | Bulgaria | 100.0 /100 | #40 | Exceptional 2.0% |
| Immigrants | Turkey | 100.0 /100 | #41 | Exceptional 2.0% |
Demographics Similar to Yuman by Single Father Households
In terms of single father households, the demographic groups most similar to Yuman are Colville (3.3%, a difference of 0.020%), Paiute (3.3%, a difference of 0.050%), Pueblo (3.3%, a difference of 0.30%), Sioux (3.3%, a difference of 0.98%), and Alaskan Athabascan (3.4%, a difference of 2.5%).
| Demographics | Rating | Rank | Single Father Households |
| Bangladeshis | 0.0 /100 | #327 | Tragic 3.1% |
| Immigrants | Cabo Verde | 0.0 /100 | #328 | Tragic 3.1% |
| Chippewa | 0.0 /100 | #329 | Tragic 3.1% |
| Nepalese | 0.0 /100 | #330 | Tragic 3.1% |
| Navajo | 0.0 /100 | #331 | Tragic 3.2% |
| Yaqui | 0.0 /100 | #332 | Tragic 3.2% |
| Natives/Alaskans | 0.0 /100 | #333 | Tragic 3.2% |
| Yuman | 0.0 /100 | #334 | Tragic 3.3% |
| Colville | 0.0 /100 | #335 | Tragic 3.3% |
| Paiute | 0.0 /100 | #336 | Tragic 3.3% |
| Pueblo | 0.0 /100 | #337 | Tragic 3.3% |
| Sioux | 0.0 /100 | #338 | Tragic 3.3% |
| Alaskan Athabascans | 0.0 /100 | #339 | Tragic 3.4% |
| Alaska Natives | 0.0 /100 | #340 | Tragic 3.5% |
| Crow | 0.0 /100 | #341 | Tragic 3.5% |