Immigrants from Argentina vs Tohono O'odham Ambulatory Disability
COMPARE
Immigrants from Argentina
Tohono O'odham
Ambulatory Disability
Ambulatory Disability Comparison
Immigrants from Argentina
Tohono O'odham
5.6%
AMBULATORY DISABILITY
99.9/ 100
METRIC RATING
48th/ 347
METRIC RANK
8.7%
AMBULATORY DISABILITY
0.0/ 100
METRIC RATING
343rd/ 347
METRIC RANK
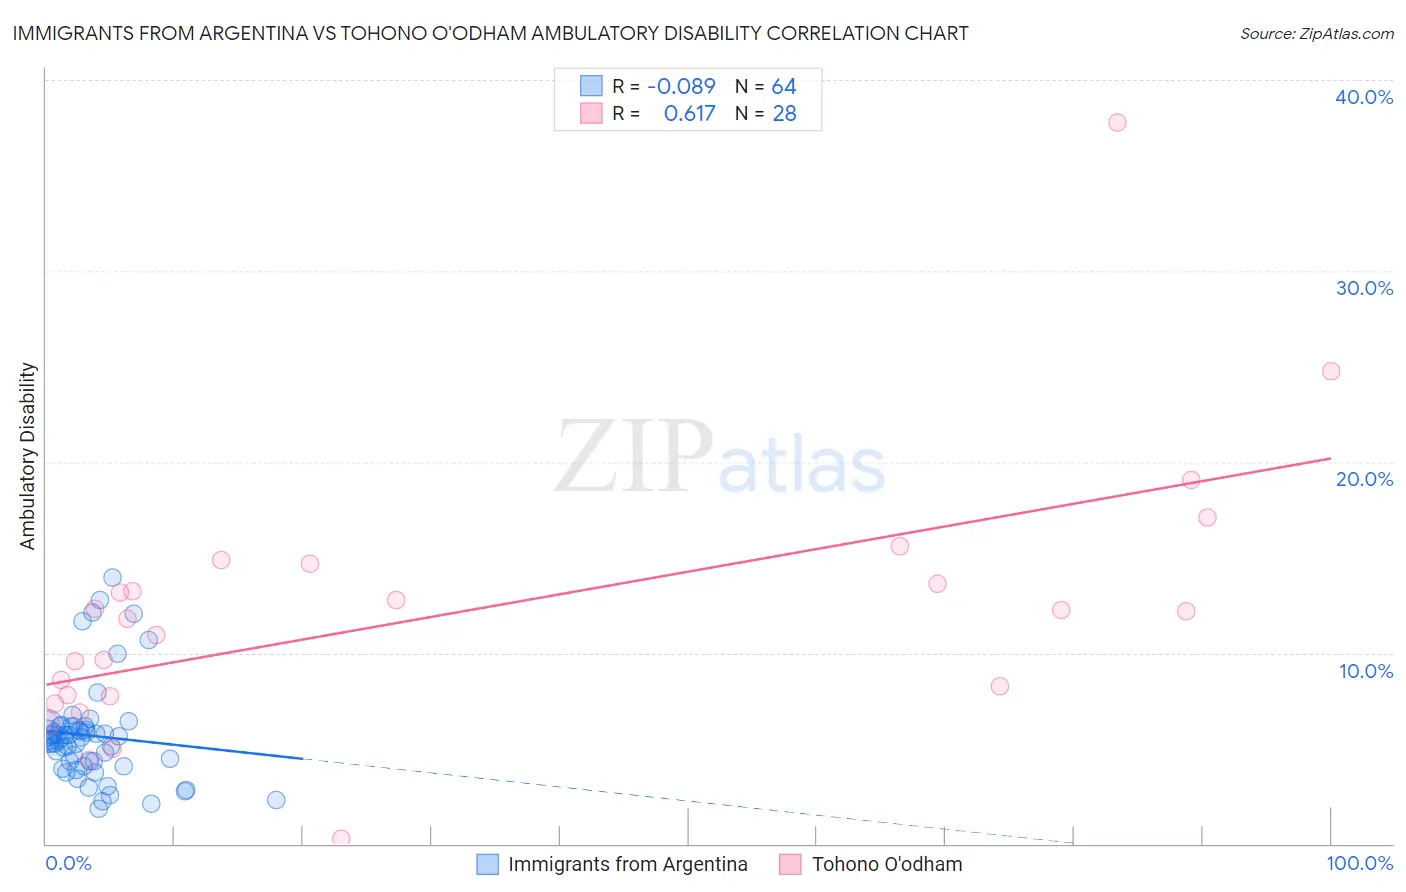
Immigrants from Argentina vs Tohono O'odham Ambulatory Disability Correlation Chart
The statistical analysis conducted on geographies consisting of 264,391,050 people shows a slight negative correlation between the proportion of Immigrants from Argentina and percentage of population with ambulatory disability in the United States with a correlation coefficient (R) of -0.089 and weighted average of 5.6%. Similarly, the statistical analysis conducted on geographies consisting of 58,714,537 people shows a significant positive correlation between the proportion of Tohono O'odham and percentage of population with ambulatory disability in the United States with a correlation coefficient (R) of 0.617 and weighted average of 8.7%, a difference of 57.2%.
Ambulatory Disability Correlation Summary
| Measurement | Immigrants from Argentina | Tohono O'odham |
| Minimum | 1.8% | 0.26% |
| Maximum | 14.0% | 37.8% |
| Range | 12.2% | 37.5% |
| Mean | 5.7% | 12.1% |
| Median | 5.4% | 12.0% |
| Interquartile 25% (IQ1) | 4.2% | 7.8% |
| Interquartile 75% (IQ3) | 6.1% | 14.2% |
| Interquartile Range (IQR) | 1.9% | 6.4% |
| Standard Deviation (Sample) | 2.6% | 7.0% |
| Standard Deviation (Population) | 2.6% | 6.9% |
Similar Demographics by Ambulatory Disability
Demographics Similar to Immigrants from Argentina by Ambulatory Disability
In terms of ambulatory disability, the demographic groups most similar to Immigrants from Argentina are Immigrants from Japan (5.6%, a difference of 0.010%), Immigrants from Sweden (5.6%, a difference of 0.020%), Egyptian (5.6%, a difference of 0.020%), Immigrants from Indonesia (5.5%, a difference of 0.19%), and Bulgarian (5.6%, a difference of 0.19%).
| Demographics | Rating | Rank | Ambulatory Disability |
| Mongolians | 99.9 /100 | #41 | Exceptional 5.5% |
| Argentineans | 99.9 /100 | #42 | Exceptional 5.5% |
| Paraguayans | 99.9 /100 | #43 | Exceptional 5.5% |
| Immigrants | Indonesia | 99.9 /100 | #44 | Exceptional 5.5% |
| Immigrants | Sweden | 99.9 /100 | #45 | Exceptional 5.6% |
| Egyptians | 99.9 /100 | #46 | Exceptional 5.6% |
| Immigrants | Japan | 99.9 /100 | #47 | Exceptional 5.6% |
| Immigrants | Argentina | 99.9 /100 | #48 | Exceptional 5.6% |
| Bulgarians | 99.9 /100 | #49 | Exceptional 5.6% |
| Luxembourgers | 99.9 /100 | #50 | Exceptional 5.6% |
| Taiwanese | 99.8 /100 | #51 | Exceptional 5.6% |
| Jordanians | 99.8 /100 | #52 | Exceptional 5.6% |
| Immigrants | Egypt | 99.8 /100 | #53 | Exceptional 5.6% |
| Immigrants | Eastern Africa | 99.8 /100 | #54 | Exceptional 5.6% |
| Immigrants | Bulgaria | 99.8 /100 | #55 | Exceptional 5.6% |
Demographics Similar to Tohono O'odham by Ambulatory Disability
In terms of ambulatory disability, the demographic groups most similar to Tohono O'odham are Tsimshian (8.8%, a difference of 0.97%), Kiowa (8.6%, a difference of 1.5%), Puerto Rican (8.9%, a difference of 1.6%), Creek (8.5%, a difference of 3.4%), and Choctaw (8.3%, a difference of 5.1%).
| Demographics | Rating | Rank | Ambulatory Disability |
| Cherokee | 0.0 /100 | #333 | Tragic 7.9% |
| Yuman | 0.0 /100 | #334 | Tragic 7.9% |
| Chickasaw | 0.0 /100 | #335 | Tragic 8.0% |
| Seminole | 0.0 /100 | #336 | Tragic 8.0% |
| Dutch West Indians | 0.0 /100 | #337 | Tragic 8.2% |
| Colville | 0.0 /100 | #338 | Tragic 8.2% |
| Pima | 0.0 /100 | #339 | Tragic 8.2% |
| Choctaw | 0.0 /100 | #340 | Tragic 8.3% |
| Creek | 0.0 /100 | #341 | Tragic 8.5% |
| Kiowa | 0.0 /100 | #342 | Tragic 8.6% |
| Tohono O'odham | 0.0 /100 | #343 | Tragic 8.7% |
| Tsimshian | 0.0 /100 | #344 | Tragic 8.8% |
| Puerto Ricans | 0.0 /100 | #345 | Tragic 8.9% |
| Houma | 0.0 /100 | #346 | Tragic 9.3% |
| Lumbee | 0.0 /100 | #347 | Tragic 9.5% |