Immigrants from Argentina vs Immigrants from Caribbean Ambulatory Disability
COMPARE
Immigrants from Argentina
Immigrants from Caribbean
Ambulatory Disability
Ambulatory Disability Comparison
Immigrants from Argentina
Immigrants from Caribbean
5.6%
AMBULATORY DISABILITY
99.9/ 100
METRIC RATING
48th/ 347
METRIC RANK
6.7%
AMBULATORY DISABILITY
0.0/ 100
METRIC RATING
279th/ 347
METRIC RANK
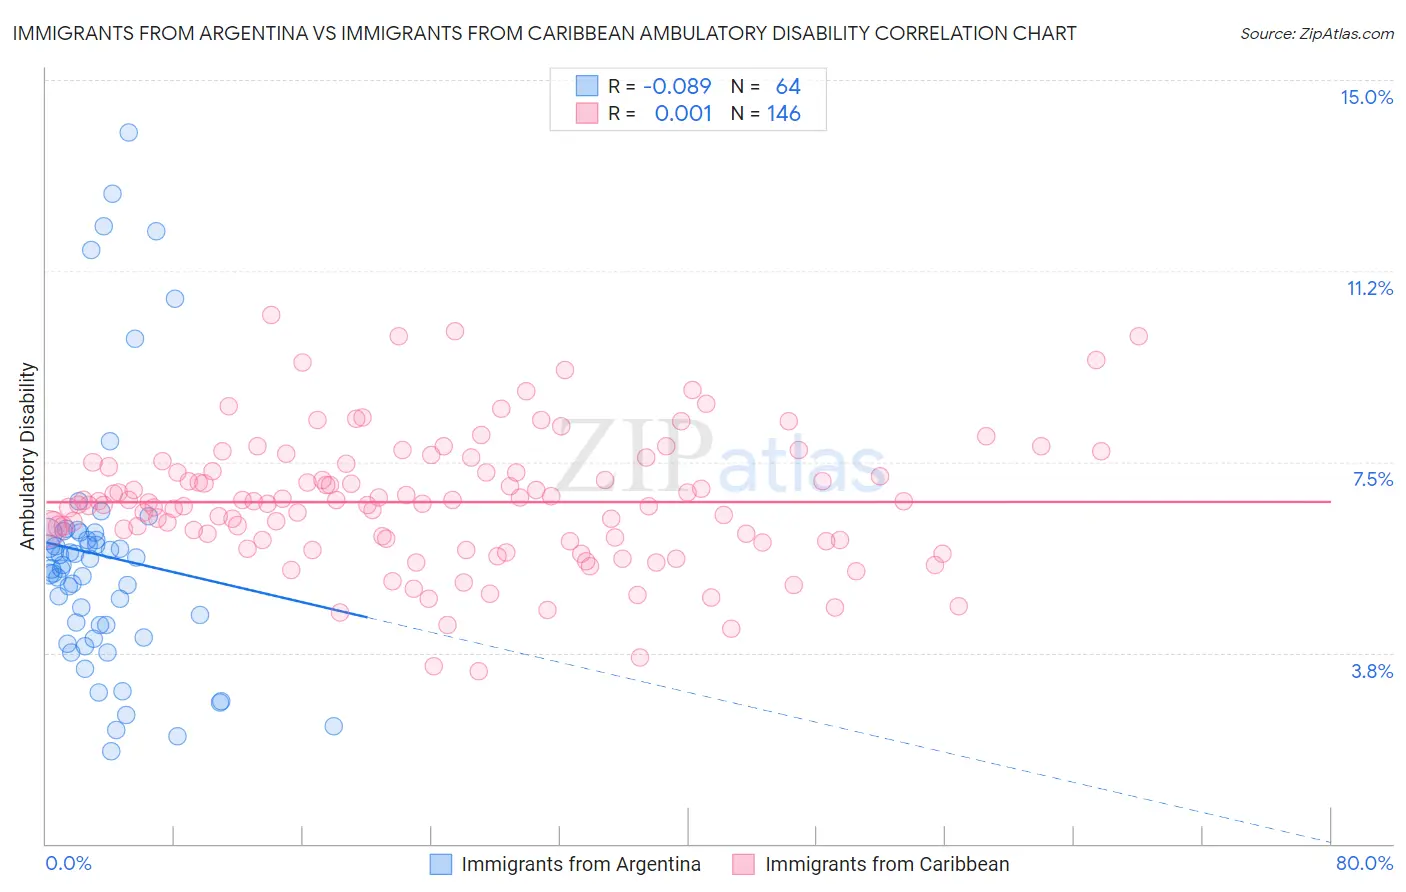
Immigrants from Argentina vs Immigrants from Caribbean Ambulatory Disability Correlation Chart
The statistical analysis conducted on geographies consisting of 264,391,050 people shows a slight negative correlation between the proportion of Immigrants from Argentina and percentage of population with ambulatory disability in the United States with a correlation coefficient (R) of -0.089 and weighted average of 5.6%. Similarly, the statistical analysis conducted on geographies consisting of 449,814,526 people shows no correlation between the proportion of Immigrants from Caribbean and percentage of population with ambulatory disability in the United States with a correlation coefficient (R) of 0.001 and weighted average of 6.7%, a difference of 21.4%.
Ambulatory Disability Correlation Summary
| Measurement | Immigrants from Argentina | Immigrants from Caribbean |
| Minimum | 1.8% | 3.4% |
| Maximum | 14.0% | 10.4% |
| Range | 12.2% | 7.0% |
| Mean | 5.7% | 6.7% |
| Median | 5.4% | 6.7% |
| Interquartile 25% (IQ1) | 4.2% | 6.0% |
| Interquartile 75% (IQ3) | 6.1% | 7.4% |
| Interquartile Range (IQR) | 1.9% | 1.4% |
| Standard Deviation (Sample) | 2.6% | 1.3% |
| Standard Deviation (Population) | 2.6% | 1.3% |
Similar Demographics by Ambulatory Disability
Demographics Similar to Immigrants from Argentina by Ambulatory Disability
In terms of ambulatory disability, the demographic groups most similar to Immigrants from Argentina are Immigrants from Japan (5.6%, a difference of 0.010%), Immigrants from Sweden (5.6%, a difference of 0.020%), Egyptian (5.6%, a difference of 0.020%), Immigrants from Indonesia (5.5%, a difference of 0.19%), and Bulgarian (5.6%, a difference of 0.19%).
| Demographics | Rating | Rank | Ambulatory Disability |
| Mongolians | 99.9 /100 | #41 | Exceptional 5.5% |
| Argentineans | 99.9 /100 | #42 | Exceptional 5.5% |
| Paraguayans | 99.9 /100 | #43 | Exceptional 5.5% |
| Immigrants | Indonesia | 99.9 /100 | #44 | Exceptional 5.5% |
| Immigrants | Sweden | 99.9 /100 | #45 | Exceptional 5.6% |
| Egyptians | 99.9 /100 | #46 | Exceptional 5.6% |
| Immigrants | Japan | 99.9 /100 | #47 | Exceptional 5.6% |
| Immigrants | Argentina | 99.9 /100 | #48 | Exceptional 5.6% |
| Bulgarians | 99.9 /100 | #49 | Exceptional 5.6% |
| Luxembourgers | 99.9 /100 | #50 | Exceptional 5.6% |
| Taiwanese | 99.8 /100 | #51 | Exceptional 5.6% |
| Jordanians | 99.8 /100 | #52 | Exceptional 5.6% |
| Immigrants | Egypt | 99.8 /100 | #53 | Exceptional 5.6% |
| Immigrants | Eastern Africa | 99.8 /100 | #54 | Exceptional 5.6% |
| Immigrants | Bulgaria | 99.8 /100 | #55 | Exceptional 5.6% |
Demographics Similar to Immigrants from Caribbean by Ambulatory Disability
In terms of ambulatory disability, the demographic groups most similar to Immigrants from Caribbean are Pennsylvania German (6.8%, a difference of 0.10%), Yaqui (6.8%, a difference of 0.17%), Barbadian (6.8%, a difference of 0.30%), Immigrants from West Indies (6.7%, a difference of 0.31%), and Jamaican (6.7%, a difference of 0.39%).
| Demographics | Rating | Rank | Ambulatory Disability |
| French Canadians | 0.1 /100 | #272 | Tragic 6.7% |
| Whites/Caucasians | 0.1 /100 | #273 | Tragic 6.7% |
| Sioux | 0.1 /100 | #274 | Tragic 6.7% |
| Immigrants | Guyana | 0.1 /100 | #275 | Tragic 6.7% |
| Celtics | 0.1 /100 | #276 | Tragic 6.7% |
| Jamaicans | 0.1 /100 | #277 | Tragic 6.7% |
| Immigrants | West Indies | 0.1 /100 | #278 | Tragic 6.7% |
| Immigrants | Caribbean | 0.0 /100 | #279 | Tragic 6.7% |
| Pennsylvania Germans | 0.0 /100 | #280 | Tragic 6.8% |
| Yaqui | 0.0 /100 | #281 | Tragic 6.8% |
| Barbadians | 0.0 /100 | #282 | Tragic 6.8% |
| Immigrants | Barbados | 0.0 /100 | #283 | Tragic 6.8% |
| Immigrants | Jamaica | 0.0 /100 | #284 | Tragic 6.8% |
| Fijians | 0.0 /100 | #285 | Tragic 6.8% |
| Yakama | 0.0 /100 | #286 | Tragic 6.8% |