Immigrants from Argentina vs Immigrants from Bosnia and Herzegovina Ambulatory Disability
COMPARE
Immigrants from Argentina
Immigrants from Bosnia and Herzegovina
Ambulatory Disability
Ambulatory Disability Comparison
Immigrants from Argentina
Immigrants from Bosnia and Herzegovina
5.6%
AMBULATORY DISABILITY
99.9/ 100
METRIC RATING
48th/ 347
METRIC RANK
6.2%
AMBULATORY DISABILITY
37.2/ 100
METRIC RATING
185th/ 347
METRIC RANK
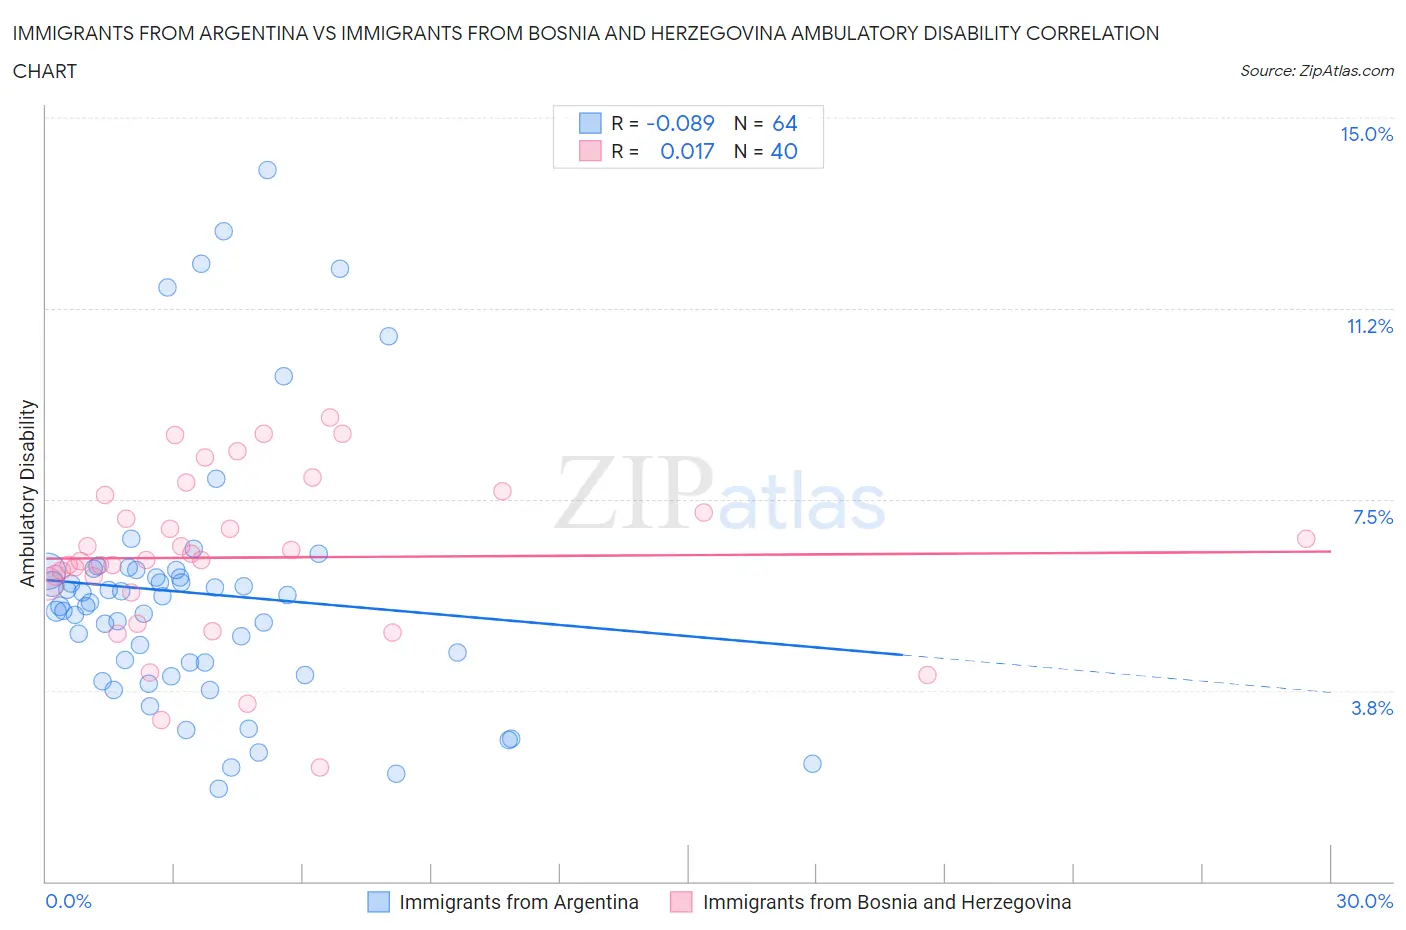
Immigrants from Argentina vs Immigrants from Bosnia and Herzegovina Ambulatory Disability Correlation Chart
The statistical analysis conducted on geographies consisting of 264,391,050 people shows a slight negative correlation between the proportion of Immigrants from Argentina and percentage of population with ambulatory disability in the United States with a correlation coefficient (R) of -0.089 and weighted average of 5.6%. Similarly, the statistical analysis conducted on geographies consisting of 156,818,181 people shows no correlation between the proportion of Immigrants from Bosnia and Herzegovina and percentage of population with ambulatory disability in the United States with a correlation coefficient (R) of 0.017 and weighted average of 6.2%, a difference of 10.8%.
Ambulatory Disability Correlation Summary
| Measurement | Immigrants from Argentina | Immigrants from Bosnia and Herzegovina |
| Minimum | 1.8% | 2.2% |
| Maximum | 14.0% | 9.1% |
| Range | 12.2% | 6.9% |
| Mean | 5.7% | 6.4% |
| Median | 5.4% | 6.3% |
| Interquartile 25% (IQ1) | 4.2% | 5.8% |
| Interquartile 75% (IQ3) | 6.1% | 7.4% |
| Interquartile Range (IQR) | 1.9% | 1.7% |
| Standard Deviation (Sample) | 2.6% | 1.6% |
| Standard Deviation (Population) | 2.6% | 1.6% |
Similar Demographics by Ambulatory Disability
Demographics Similar to Immigrants from Argentina by Ambulatory Disability
In terms of ambulatory disability, the demographic groups most similar to Immigrants from Argentina are Immigrants from Japan (5.6%, a difference of 0.010%), Immigrants from Sweden (5.6%, a difference of 0.020%), Egyptian (5.6%, a difference of 0.020%), Immigrants from Indonesia (5.5%, a difference of 0.19%), and Bulgarian (5.6%, a difference of 0.19%).
| Demographics | Rating | Rank | Ambulatory Disability |
| Mongolians | 99.9 /100 | #41 | Exceptional 5.5% |
| Argentineans | 99.9 /100 | #42 | Exceptional 5.5% |
| Paraguayans | 99.9 /100 | #43 | Exceptional 5.5% |
| Immigrants | Indonesia | 99.9 /100 | #44 | Exceptional 5.5% |
| Immigrants | Sweden | 99.9 /100 | #45 | Exceptional 5.6% |
| Egyptians | 99.9 /100 | #46 | Exceptional 5.6% |
| Immigrants | Japan | 99.9 /100 | #47 | Exceptional 5.6% |
| Immigrants | Argentina | 99.9 /100 | #48 | Exceptional 5.6% |
| Bulgarians | 99.9 /100 | #49 | Exceptional 5.6% |
| Luxembourgers | 99.9 /100 | #50 | Exceptional 5.6% |
| Taiwanese | 99.8 /100 | #51 | Exceptional 5.6% |
| Jordanians | 99.8 /100 | #52 | Exceptional 5.6% |
| Immigrants | Egypt | 99.8 /100 | #53 | Exceptional 5.6% |
| Immigrants | Eastern Africa | 99.8 /100 | #54 | Exceptional 5.6% |
| Immigrants | Bulgaria | 99.8 /100 | #55 | Exceptional 5.6% |
Demographics Similar to Immigrants from Bosnia and Herzegovina by Ambulatory Disability
In terms of ambulatory disability, the demographic groups most similar to Immigrants from Bosnia and Herzegovina are European (6.2%, a difference of 0.060%), Carpatho Rusyn (6.2%, a difference of 0.11%), British (6.2%, a difference of 0.17%), Ukrainian (6.2%, a difference of 0.19%), and Immigrants from Ghana (6.1%, a difference of 0.22%).
| Demographics | Rating | Rank | Ambulatory Disability |
| Scandinavians | 44.5 /100 | #178 | Average 6.1% |
| Austrians | 44.1 /100 | #179 | Average 6.1% |
| Immigrants | Nicaragua | 43.9 /100 | #180 | Average 6.1% |
| Swiss | 43.1 /100 | #181 | Average 6.1% |
| Serbians | 42.8 /100 | #182 | Average 6.1% |
| Immigrants | Thailand | 42.2 /100 | #183 | Average 6.1% |
| Immigrants | Ghana | 41.2 /100 | #184 | Average 6.1% |
| Immigrants | Bosnia and Herzegovina | 37.2 /100 | #185 | Fair 6.2% |
| Europeans | 36.2 /100 | #186 | Fair 6.2% |
| Carpatho Rusyns | 35.3 /100 | #187 | Fair 6.2% |
| British | 34.3 /100 | #188 | Fair 6.2% |
| Ukrainians | 34.0 /100 | #189 | Fair 6.2% |
| Immigrants | Western Africa | 33.4 /100 | #190 | Fair 6.2% |
| Immigrants | Guatemala | 31.9 /100 | #191 | Fair 6.2% |
| Immigrants | Western Europe | 31.6 /100 | #192 | Fair 6.2% |