Immigrants from Costa Rica vs Immigrants from Zimbabwe Disability Age Under 5
COMPARE
Immigrants from Costa Rica
Immigrants from Zimbabwe
Disability Age Under 5
Disability Age Under 5 Comparison
Immigrants from Costa Rica
Immigrants from Zimbabwe
1.3%
DISABILITY AGE UNDER 5
5.5/ 100
METRIC RATING
229th/ 347
METRIC RANK
1.2%
DISABILITY AGE UNDER 5
77.9/ 100
METRIC RATING
145th/ 347
METRIC RANK
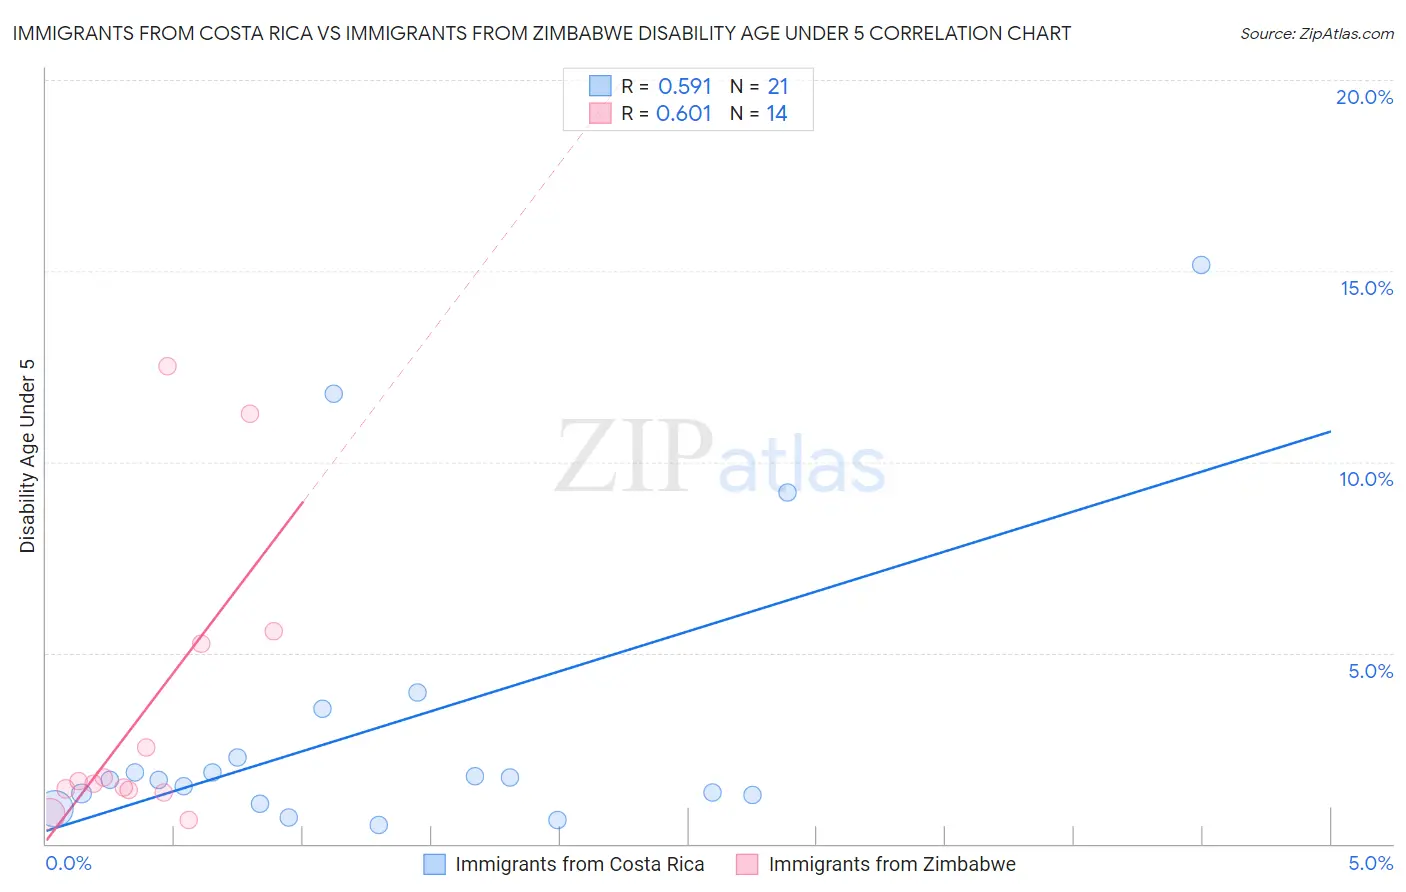
Immigrants from Costa Rica vs Immigrants from Zimbabwe Disability Age Under 5 Correlation Chart
The statistical analysis conducted on geographies consisting of 133,028,674 people shows a substantial positive correlation between the proportion of Immigrants from Costa Rica and percentage of population with a disability under the age of 5 in the United States with a correlation coefficient (R) of 0.591 and weighted average of 1.3%. Similarly, the statistical analysis conducted on geographies consisting of 89,065,062 people shows a significant positive correlation between the proportion of Immigrants from Zimbabwe and percentage of population with a disability under the age of 5 in the United States with a correlation coefficient (R) of 0.601 and weighted average of 1.2%, a difference of 9.6%.
Disability Age Under 5 Correlation Summary
| Measurement | Immigrants from Costa Rica | Immigrants from Zimbabwe |
| Minimum | 0.49% | 0.62% |
| Maximum | 15.2% | 12.5% |
| Range | 14.7% | 11.9% |
| Mean | 3.1% | 3.5% |
| Median | 1.7% | 1.6% |
| Interquartile 25% (IQ1) | 1.2% | 1.4% |
| Interquartile 75% (IQ3) | 2.9% | 5.2% |
| Interquartile Range (IQR) | 1.7% | 3.8% |
| Standard Deviation (Sample) | 3.9% | 3.9% |
| Standard Deviation (Population) | 3.8% | 3.7% |
Similar Demographics by Disability Age Under 5
Demographics Similar to Immigrants from Costa Rica by Disability Age Under 5
In terms of disability age under 5, the demographic groups most similar to Immigrants from Costa Rica are Lebanese (1.3%, a difference of 0.10%), Luxembourger (1.3%, a difference of 0.21%), Taiwanese (1.3%, a difference of 0.23%), Immigrants from Northern Europe (1.3%, a difference of 0.34%), and French American Indian (1.3%, a difference of 0.47%).
| Demographics | Rating | Rank | Disability Age Under 5 |
| Ukrainians | 8.3 /100 | #222 | Tragic 1.3% |
| Hispanics or Latinos | 7.7 /100 | #223 | Tragic 1.3% |
| Latvians | 7.1 /100 | #224 | Tragic 1.3% |
| Panamanians | 7.1 /100 | #225 | Tragic 1.3% |
| Bahamians | 7.1 /100 | #226 | Tragic 1.3% |
| Taiwanese | 6.1 /100 | #227 | Tragic 1.3% |
| Luxembourgers | 6.1 /100 | #228 | Tragic 1.3% |
| Immigrants | Costa Rica | 5.5 /100 | #229 | Tragic 1.3% |
| Lebanese | 5.3 /100 | #230 | Tragic 1.3% |
| Immigrants | Northern Europe | 4.7 /100 | #231 | Tragic 1.3% |
| French American Indians | 4.5 /100 | #232 | Tragic 1.3% |
| Tongans | 4.2 /100 | #233 | Tragic 1.3% |
| Pueblo | 3.8 /100 | #234 | Tragic 1.3% |
| Central American Indians | 3.6 /100 | #235 | Tragic 1.3% |
| South American Indians | 3.3 /100 | #236 | Tragic 1.3% |
Demographics Similar to Immigrants from Zimbabwe by Disability Age Under 5
In terms of disability age under 5, the demographic groups most similar to Immigrants from Zimbabwe are Samoan (1.2%, a difference of 0.040%), Immigrants from Middle Africa (1.2%, a difference of 0.18%), Immigrants from Colombia (1.2%, a difference of 0.19%), Alsatian (1.2%, a difference of 0.19%), and Icelander (1.2%, a difference of 0.21%).
| Demographics | Rating | Rank | Disability Age Under 5 |
| Immigrants | Czechoslovakia | 82.8 /100 | #138 | Excellent 1.2% |
| New Zealanders | 81.4 /100 | #139 | Excellent 1.2% |
| Somalis | 80.8 /100 | #140 | Excellent 1.2% |
| Immigrants | Honduras | 80.4 /100 | #141 | Excellent 1.2% |
| Immigrants | Colombia | 79.3 /100 | #142 | Good 1.2% |
| Alsatians | 79.3 /100 | #143 | Good 1.2% |
| Immigrants | Middle Africa | 79.3 /100 | #144 | Good 1.2% |
| Immigrants | Zimbabwe | 77.9 /100 | #145 | Good 1.2% |
| Samoans | 77.7 /100 | #146 | Good 1.2% |
| Icelanders | 76.3 /100 | #147 | Good 1.2% |
| Ghanaians | 76.3 /100 | #148 | Good 1.2% |
| Kenyans | 75.9 /100 | #149 | Good 1.2% |
| South Americans | 75.6 /100 | #150 | Good 1.2% |
| Yaqui | 74.8 /100 | #151 | Good 1.2% |
| Hondurans | 72.5 /100 | #152 | Good 1.2% |