Immigrants from Argentina vs Immigrants from Zimbabwe Disability Age 35 to 64
COMPARE
Immigrants from Argentina
Immigrants from Zimbabwe
Disability Age 35 to 64
Disability Age 35 to 64 Comparison
Immigrants from Argentina
Immigrants from Zimbabwe
9.3%
DISABILITY AGE 35 TO 64
100.0/ 100
METRIC RATING
20th/ 347
METRIC RANK
10.6%
DISABILITY AGE 35 TO 64
94.0/ 100
METRIC RATING
127th/ 347
METRIC RANK
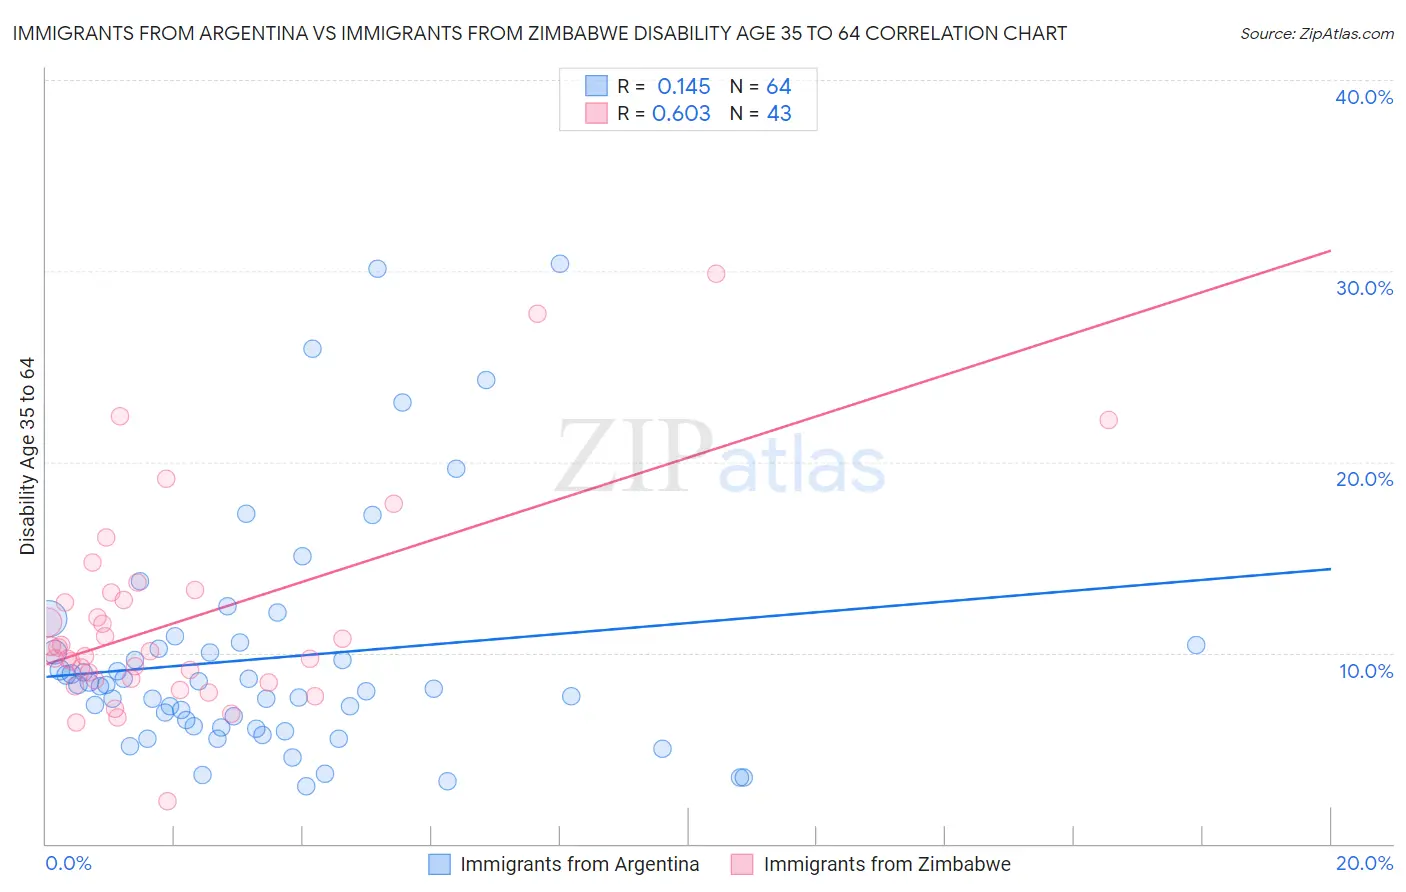
Immigrants from Argentina vs Immigrants from Zimbabwe Disability Age 35 to 64 Correlation Chart
The statistical analysis conducted on geographies consisting of 264,341,795 people shows a poor positive correlation between the proportion of Immigrants from Argentina and percentage of population with a disability between the ages 34 and 64 in the United States with a correlation coefficient (R) of 0.145 and weighted average of 9.3%. Similarly, the statistical analysis conducted on geographies consisting of 117,791,750 people shows a significant positive correlation between the proportion of Immigrants from Zimbabwe and percentage of population with a disability between the ages 34 and 64 in the United States with a correlation coefficient (R) of 0.603 and weighted average of 10.6%, a difference of 14.3%.
Disability Age 35 to 64 Correlation Summary
| Measurement | Immigrants from Argentina | Immigrants from Zimbabwe |
| Minimum | 3.0% | 2.2% |
| Maximum | 30.4% | 29.9% |
| Range | 27.4% | 27.6% |
| Mean | 9.7% | 11.7% |
| Median | 8.3% | 10.1% |
| Interquartile 25% (IQ1) | 6.1% | 8.6% |
| Interquartile 75% (IQ3) | 10.3% | 13.2% |
| Interquartile Range (IQR) | 4.2% | 4.5% |
| Standard Deviation (Sample) | 6.0% | 5.5% |
| Standard Deviation (Population) | 6.0% | 5.4% |
Similar Demographics by Disability Age 35 to 64
Demographics Similar to Immigrants from Argentina by Disability Age 35 to 64
In terms of disability age 35 to 64, the demographic groups most similar to Immigrants from Argentina are Okinawan (9.4%, a difference of 0.43%), Cypriot (9.4%, a difference of 0.46%), Immigrants from Venezuela (9.3%, a difference of 0.51%), Argentinean (9.4%, a difference of 0.68%), and Asian (9.4%, a difference of 0.69%).
| Demographics | Rating | Rank | Disability Age 35 to 64 |
| Immigrants | South Central Asia | 100.0 /100 | #13 | Exceptional 8.9% |
| Immigrants | Singapore | 100.0 /100 | #14 | Exceptional 8.9% |
| Bolivians | 100.0 /100 | #15 | Exceptional 8.9% |
| Immigrants | Korea | 100.0 /100 | #16 | Exceptional 9.0% |
| Burmese | 100.0 /100 | #17 | Exceptional 9.2% |
| Soviet Union | 100.0 /100 | #18 | Exceptional 9.2% |
| Immigrants | Venezuela | 100.0 /100 | #19 | Exceptional 9.3% |
| Immigrants | Argentina | 100.0 /100 | #20 | Exceptional 9.3% |
| Okinawans | 100.0 /100 | #21 | Exceptional 9.4% |
| Cypriots | 100.0 /100 | #22 | Exceptional 9.4% |
| Argentineans | 100.0 /100 | #23 | Exceptional 9.4% |
| Asians | 100.0 /100 | #24 | Exceptional 9.4% |
| Venezuelans | 100.0 /100 | #25 | Exceptional 9.4% |
| Immigrants | Sri Lanka | 100.0 /100 | #26 | Exceptional 9.5% |
| Immigrants | Asia | 100.0 /100 | #27 | Exceptional 9.5% |
Demographics Similar to Immigrants from Zimbabwe by Disability Age 35 to 64
In terms of disability age 35 to 64, the demographic groups most similar to Immigrants from Zimbabwe are Immigrants from Afghanistan (10.6%, a difference of 0.040%), Albanian (10.6%, a difference of 0.10%), Estonian (10.6%, a difference of 0.20%), South African (10.7%, a difference of 0.23%), and Maltese (10.6%, a difference of 0.32%).
| Demographics | Rating | Rank | Disability Age 35 to 64 |
| Vietnamese | 95.4 /100 | #120 | Exceptional 10.6% |
| Romanians | 95.0 /100 | #121 | Exceptional 10.6% |
| Immigrants | Norway | 95.0 /100 | #122 | Exceptional 10.6% |
| Maltese | 94.8 /100 | #123 | Exceptional 10.6% |
| Estonians | 94.5 /100 | #124 | Exceptional 10.6% |
| Albanians | 94.2 /100 | #125 | Exceptional 10.6% |
| Immigrants | Afghanistan | 94.1 /100 | #126 | Exceptional 10.6% |
| Immigrants | Zimbabwe | 94.0 /100 | #127 | Exceptional 10.6% |
| South Africans | 93.3 /100 | #128 | Exceptional 10.7% |
| Ecuadorians | 93.1 /100 | #129 | Exceptional 10.7% |
| Immigrants | Syria | 93.0 /100 | #130 | Exceptional 10.7% |
| Immigrants | El Salvador | 92.8 /100 | #131 | Exceptional 10.7% |
| Immigrants | Albania | 92.5 /100 | #132 | Exceptional 10.7% |
| Immigrants | Immigrants | 92.5 /100 | #133 | Exceptional 10.7% |
| Immigrants | Ecuador | 92.5 /100 | #134 | Exceptional 10.7% |