Hungarian vs Immigrants from Colombia Ambulatory Disability
COMPARE
Hungarian
Immigrants from Colombia
Ambulatory Disability
Ambulatory Disability Comparison
Hungarians
Immigrants from Colombia
6.3%
AMBULATORY DISABILITY
9.6/ 100
METRIC RATING
221st/ 347
METRIC RANK
5.8%
AMBULATORY DISABILITY
96.7/ 100
METRIC RATING
110th/ 347
METRIC RANK
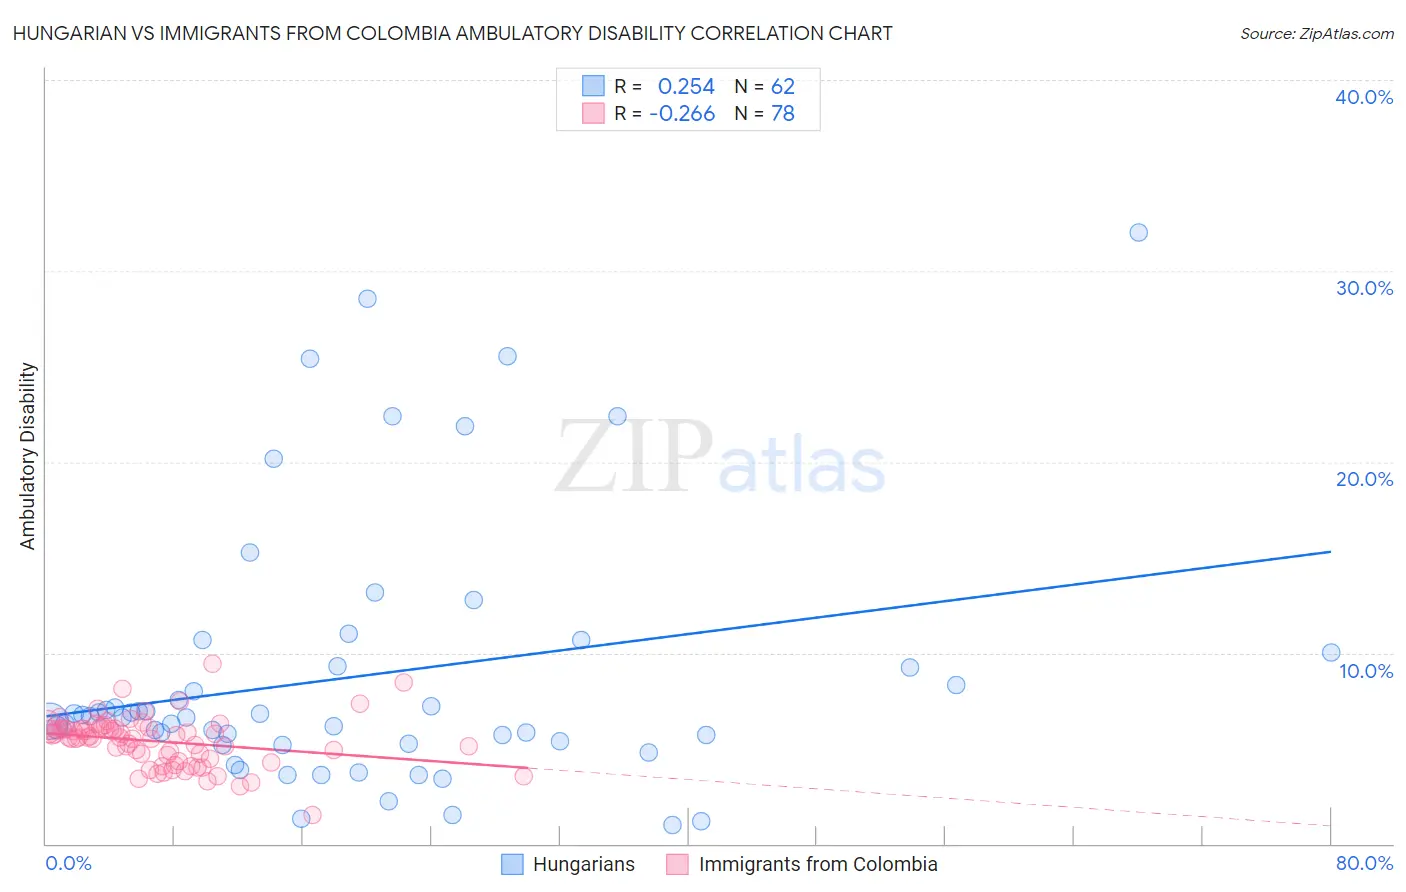
Hungarian vs Immigrants from Colombia Ambulatory Disability Correlation Chart
The statistical analysis conducted on geographies consisting of 486,018,761 people shows a weak positive correlation between the proportion of Hungarians and percentage of population with ambulatory disability in the United States with a correlation coefficient (R) of 0.254 and weighted average of 6.3%. Similarly, the statistical analysis conducted on geographies consisting of 378,592,310 people shows a weak negative correlation between the proportion of Immigrants from Colombia and percentage of population with ambulatory disability in the United States with a correlation coefficient (R) of -0.266 and weighted average of 5.8%, a difference of 7.8%.
Ambulatory Disability Correlation Summary
| Measurement | Hungarian | Immigrants from Colombia |
| Minimum | 1.0% | 1.5% |
| Maximum | 32.0% | 9.4% |
| Range | 31.0% | 7.9% |
| Mean | 8.8% | 5.4% |
| Median | 6.7% | 5.6% |
| Interquartile 25% (IQ1) | 5.2% | 4.5% |
| Interquartile 75% (IQ3) | 9.3% | 6.0% |
| Interquartile Range (IQR) | 4.1% | 1.6% |
| Standard Deviation (Sample) | 6.9% | 1.3% |
| Standard Deviation (Population) | 6.8% | 1.3% |
Similar Demographics by Ambulatory Disability
Demographics Similar to Hungarians by Ambulatory Disability
In terms of ambulatory disability, the demographic groups most similar to Hungarians are Immigrants from Albania (6.3%, a difference of 0.010%), German Russian (6.3%, a difference of 0.030%), Indonesian (6.3%, a difference of 0.050%), Guamanian/Chamorro (6.3%, a difference of 0.14%), and Yugoslavian (6.3%, a difference of 0.18%).
| Demographics | Rating | Rank | Ambulatory Disability |
| Immigrants | Mexico | 11.0 /100 | #214 | Poor 6.3% |
| Immigrants | Latin America | 11.0 /100 | #215 | Poor 6.3% |
| Canadians | 10.9 /100 | #216 | Poor 6.3% |
| Yugoslavians | 10.9 /100 | #217 | Poor 6.3% |
| Guamanians/Chamorros | 10.6 /100 | #218 | Poor 6.3% |
| Indonesians | 9.9 /100 | #219 | Tragic 6.3% |
| Immigrants | Albania | 9.6 /100 | #220 | Tragic 6.3% |
| Hungarians | 9.6 /100 | #221 | Tragic 6.3% |
| German Russians | 9.4 /100 | #222 | Tragic 6.3% |
| Immigrants | Honduras | 7.6 /100 | #223 | Tragic 6.3% |
| Liberians | 7.1 /100 | #224 | Tragic 6.3% |
| Hondurans | 6.3 /100 | #225 | Tragic 6.3% |
| Slavs | 5.1 /100 | #226 | Tragic 6.4% |
| Cubans | 4.0 /100 | #227 | Tragic 6.4% |
| Portuguese | 4.0 /100 | #228 | Tragic 6.4% |
Demographics Similar to Immigrants from Colombia by Ambulatory Disability
In terms of ambulatory disability, the demographic groups most similar to Immigrants from Colombia are Danish (5.8%, a difference of 0.070%), Immigrants from Netherlands (5.8%, a difference of 0.18%), Colombian (5.8%, a difference of 0.19%), South African (5.9%, a difference of 0.20%), and Uruguayan (5.8%, a difference of 0.21%).
| Demographics | Rating | Rank | Ambulatory Disability |
| Immigrants | Romania | 97.7 /100 | #103 | Exceptional 5.8% |
| New Zealanders | 97.6 /100 | #104 | Exceptional 5.8% |
| Immigrants | Czechoslovakia | 97.4 /100 | #105 | Exceptional 5.8% |
| Immigrants | Morocco | 97.3 /100 | #106 | Exceptional 5.8% |
| Uruguayans | 97.2 /100 | #107 | Exceptional 5.8% |
| Colombians | 97.2 /100 | #108 | Exceptional 5.8% |
| Immigrants | Netherlands | 97.1 /100 | #109 | Exceptional 5.8% |
| Immigrants | Colombia | 96.7 /100 | #110 | Exceptional 5.8% |
| Danes | 96.6 /100 | #111 | Exceptional 5.8% |
| South Africans | 96.3 /100 | #112 | Exceptional 5.9% |
| Immigrants | Uruguay | 95.6 /100 | #113 | Exceptional 5.9% |
| Immigrants | Poland | 95.4 /100 | #114 | Exceptional 5.9% |
| South American Indians | 94.8 /100 | #115 | Exceptional 5.9% |
| Immigrants | Africa | 94.7 /100 | #116 | Exceptional 5.9% |
| Immigrants | South Eastern Asia | 93.6 /100 | #117 | Exceptional 5.9% |