Hungarian vs Immigrants from Switzerland In Labor Force | Age 30-34
COMPARE
Hungarian
Immigrants from Switzerland
In Labor Force | Age 30-34
In Labor Force | Age 30-34 Comparison
Hungarians
Immigrants from Switzerland
84.5%
IN LABOR FORCE | AGE 30-34
24.8/ 100
METRIC RATING
191st/ 347
METRIC RANK
85.3%
IN LABOR FORCE | AGE 30-34
98.7/ 100
METRIC RATING
79th/ 347
METRIC RANK
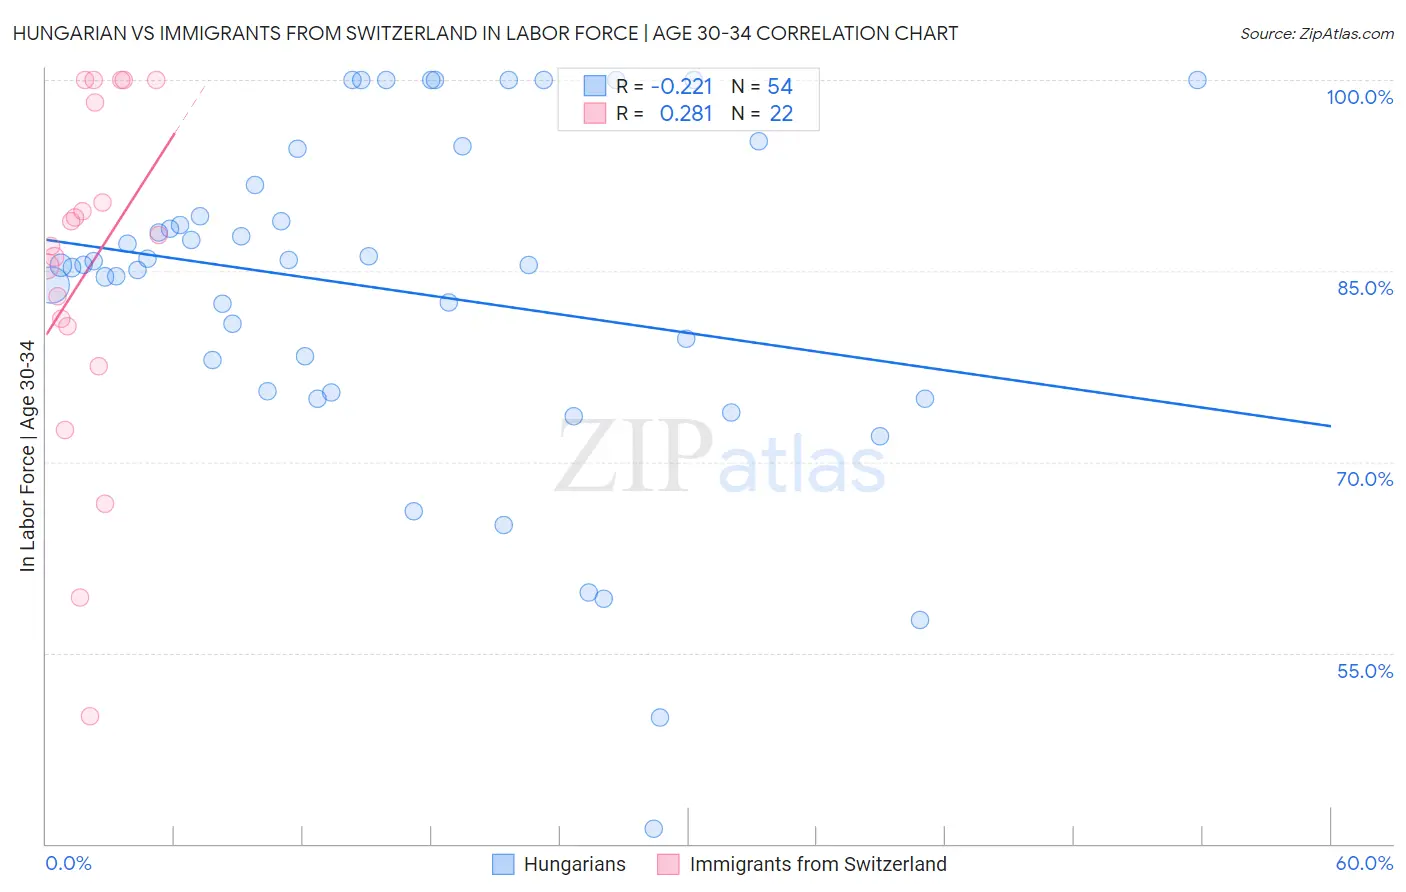
Hungarian vs Immigrants from Switzerland In Labor Force | Age 30-34 Correlation Chart
The statistical analysis conducted on geographies consisting of 485,743,554 people shows a weak negative correlation between the proportion of Hungarians and labor force participation rate among population between the ages 30 and 34 in the United States with a correlation coefficient (R) of -0.221 and weighted average of 84.5%. Similarly, the statistical analysis conducted on geographies consisting of 148,037,951 people shows a weak positive correlation between the proportion of Immigrants from Switzerland and labor force participation rate among population between the ages 30 and 34 in the United States with a correlation coefficient (R) of 0.281 and weighted average of 85.3%, a difference of 0.96%.
In Labor Force | Age 30-34 Correlation Summary
| Measurement | Hungarian | Immigrants from Switzerland |
| Minimum | 41.2% | 50.0% |
| Maximum | 100.0% | 100.0% |
| Range | 58.8% | 50.0% |
| Mean | 83.5% | 85.2% |
| Median | 85.5% | 87.4% |
| Interquartile 25% (IQ1) | 75.6% | 80.6% |
| Interquartile 75% (IQ3) | 91.7% | 98.2% |
| Interquartile Range (IQR) | 16.1% | 17.6% |
| Standard Deviation (Sample) | 13.4% | 13.6% |
| Standard Deviation (Population) | 13.2% | 13.2% |
Similar Demographics by In Labor Force | Age 30-34
Demographics Similar to Hungarians by In Labor Force | Age 30-34
In terms of in labor force | age 30-34, the demographic groups most similar to Hungarians are Scandinavian (84.5%, a difference of 0.0%), Immigrants from Zaire (84.5%, a difference of 0.010%), Immigrants from Costa Rica (84.5%, a difference of 0.010%), Immigrants from Afghanistan (84.5%, a difference of 0.010%), and Korean (84.5%, a difference of 0.020%).
| Demographics | Rating | Rank | In Labor Force | Age 30-34 |
| Immigrants | North America | 33.3 /100 | #184 | Fair 84.6% |
| Immigrants | Philippines | 31.5 /100 | #185 | Fair 84.6% |
| Immigrants | Congo | 29.7 /100 | #186 | Fair 84.6% |
| Costa Ricans | 29.6 /100 | #187 | Fair 84.6% |
| Taiwanese | 29.4 /100 | #188 | Fair 84.6% |
| Nigerians | 28.9 /100 | #189 | Fair 84.5% |
| Immigrants | Zaire | 25.8 /100 | #190 | Fair 84.5% |
| Hungarians | 24.8 /100 | #191 | Fair 84.5% |
| Scandinavians | 24.7 /100 | #192 | Fair 84.5% |
| Immigrants | Costa Rica | 23.9 /100 | #193 | Fair 84.5% |
| Immigrants | Afghanistan | 23.5 /100 | #194 | Fair 84.5% |
| Koreans | 23.2 /100 | #195 | Fair 84.5% |
| British | 22.9 /100 | #196 | Fair 84.5% |
| Immigrants | Syria | 21.9 /100 | #197 | Fair 84.5% |
| Dutch | 20.2 /100 | #198 | Fair 84.5% |
Demographics Similar to Immigrants from Switzerland by In Labor Force | Age 30-34
In terms of in labor force | age 30-34, the demographic groups most similar to Immigrants from Switzerland are Immigrants from Russia (85.3%, a difference of 0.0%), Immigrants from Singapore (85.3%, a difference of 0.010%), Slovak (85.3%, a difference of 0.010%), Immigrants from Africa (85.3%, a difference of 0.010%), and Immigrants from Europe (85.3%, a difference of 0.020%).
| Demographics | Rating | Rank | In Labor Force | Age 30-34 |
| Immigrants | China | 99.0 /100 | #72 | Exceptional 85.4% |
| Indians (Asian) | 99.0 /100 | #73 | Exceptional 85.4% |
| Maltese | 99.0 /100 | #74 | Exceptional 85.4% |
| Immigrants | Czechoslovakia | 99.0 /100 | #75 | Exceptional 85.4% |
| Iranians | 99.0 /100 | #76 | Exceptional 85.4% |
| Immigrants | Eastern Asia | 98.9 /100 | #77 | Exceptional 85.4% |
| Immigrants | Singapore | 98.8 /100 | #78 | Exceptional 85.3% |
| Immigrants | Switzerland | 98.7 /100 | #79 | Exceptional 85.3% |
| Immigrants | Russia | 98.7 /100 | #80 | Exceptional 85.3% |
| Slovaks | 98.7 /100 | #81 | Exceptional 85.3% |
| Immigrants | Africa | 98.6 /100 | #82 | Exceptional 85.3% |
| Immigrants | Europe | 98.6 /100 | #83 | Exceptional 85.3% |
| Greeks | 98.6 /100 | #84 | Exceptional 85.3% |
| Mongolians | 98.5 /100 | #85 | Exceptional 85.3% |
| Immigrants | Taiwan | 98.3 /100 | #86 | Exceptional 85.3% |