Hungarian vs Burmese Male Disability
COMPARE
Hungarian
Burmese
Male Disability
Male Disability Comparison
Hungarians
Burmese
12.0%
MALE DISABILITY
0.8/ 100
METRIC RATING
247th/ 347
METRIC RANK
10.0%
MALE DISABILITY
100.0/ 100
METRIC RATING
21st/ 347
METRIC RANK
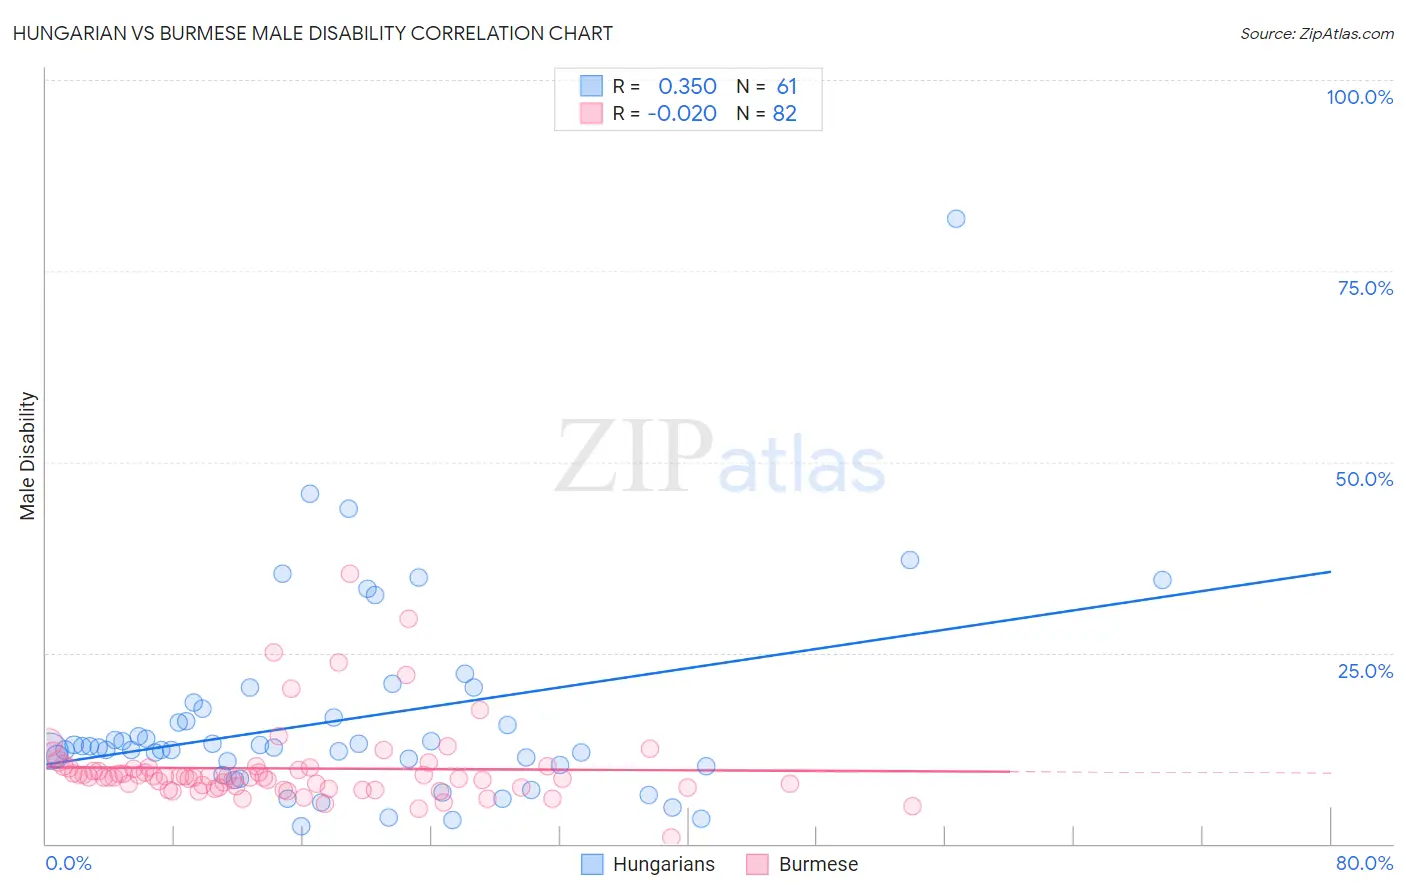
Hungarian vs Burmese Male Disability Correlation Chart
The statistical analysis conducted on geographies consisting of 486,137,114 people shows a mild positive correlation between the proportion of Hungarians and percentage of males with a disability in the United States with a correlation coefficient (R) of 0.350 and weighted average of 12.0%. Similarly, the statistical analysis conducted on geographies consisting of 465,271,159 people shows no correlation between the proportion of Burmese and percentage of males with a disability in the United States with a correlation coefficient (R) of -0.020 and weighted average of 10.0%, a difference of 19.9%.
Male Disability Correlation Summary
| Measurement | Hungarian | Burmese |
| Minimum | 2.3% | 0.74% |
| Maximum | 81.8% | 35.3% |
| Range | 79.5% | 34.6% |
| Mean | 16.2% | 9.9% |
| Median | 12.6% | 8.8% |
| Interquartile 25% (IQ1) | 10.2% | 7.3% |
| Interquartile 75% (IQ3) | 17.1% | 9.9% |
| Interquartile Range (IQR) | 6.9% | 2.6% |
| Standard Deviation (Sample) | 13.0% | 5.2% |
| Standard Deviation (Population) | 12.9% | 5.2% |
Similar Demographics by Male Disability
Demographics Similar to Hungarians by Male Disability
In terms of male disability, the demographic groups most similar to Hungarians are Polish (12.0%, a difference of 0.18%), Danish (11.9%, a difference of 0.19%), Immigrants from Laos (11.9%, a difference of 0.22%), Immigrants from Liberia (11.9%, a difference of 0.22%), and Samoan (11.9%, a difference of 0.34%).
| Demographics | Rating | Rank | Male Disability |
| Czechs | 1.1 /100 | #240 | Tragic 11.9% |
| Bahamians | 1.1 /100 | #241 | Tragic 11.9% |
| Northern Europeans | 1.1 /100 | #242 | Tragic 11.9% |
| Samoans | 1.1 /100 | #243 | Tragic 11.9% |
| Immigrants | Laos | 1.0 /100 | #244 | Tragic 11.9% |
| Immigrants | Liberia | 1.0 /100 | #245 | Tragic 11.9% |
| Danes | 0.9 /100 | #246 | Tragic 11.9% |
| Hungarians | 0.8 /100 | #247 | Tragic 12.0% |
| Poles | 0.7 /100 | #248 | Tragic 12.0% |
| Immigrants | Yemen | 0.5 /100 | #249 | Tragic 12.0% |
| Bangladeshis | 0.5 /100 | #250 | Tragic 12.0% |
| German Russians | 0.5 /100 | #251 | Tragic 12.0% |
| Slovenes | 0.5 /100 | #252 | Tragic 12.0% |
| Guamanians/Chamorros | 0.5 /100 | #253 | Tragic 12.0% |
| British | 0.4 /100 | #254 | Tragic 12.1% |
Demographics Similar to Burmese by Male Disability
In terms of male disability, the demographic groups most similar to Burmese are Asian (10.0%, a difference of 0.11%), Immigrants from Sri Lanka (10.0%, a difference of 0.16%), Immigrants from Venezuela (10.0%, a difference of 0.29%), Cypriot (10.0%, a difference of 0.38%), and Immigrants from Asia (10.0%, a difference of 0.51%).
| Demographics | Rating | Rank | Male Disability |
| Immigrants | Iran | 100.0 /100 | #14 | Exceptional 9.7% |
| Indians (Asian) | 100.0 /100 | #15 | Exceptional 9.7% |
| Okinawans | 100.0 /100 | #16 | Exceptional 9.8% |
| Immigrants | Korea | 100.0 /100 | #17 | Exceptional 9.8% |
| Immigrants | Pakistan | 100.0 /100 | #18 | Exceptional 9.8% |
| Immigrants | Sri Lanka | 100.0 /100 | #19 | Exceptional 10.0% |
| Asians | 100.0 /100 | #20 | Exceptional 10.0% |
| Burmese | 100.0 /100 | #21 | Exceptional 10.0% |
| Immigrants | Venezuela | 100.0 /100 | #22 | Exceptional 10.0% |
| Cypriots | 100.0 /100 | #23 | Exceptional 10.0% |
| Immigrants | Asia | 100.0 /100 | #24 | Exceptional 10.0% |
| Immigrants | Malaysia | 99.9 /100 | #25 | Exceptional 10.0% |
| Paraguayans | 99.9 /100 | #26 | Exceptional 10.1% |
| Egyptians | 99.9 /100 | #27 | Exceptional 10.1% |
| Vietnamese | 99.9 /100 | #28 | Exceptional 10.1% |