Houma vs Immigrants from Malaysia Cognitive Disability
COMPARE
Houma
Immigrants from Malaysia
Cognitive Disability
Cognitive Disability Comparison
Houma
Immigrants from Malaysia
19.3%
COGNITIVE DISABILITY
0.0/ 100
METRIC RATING
342nd/ 347
METRIC RANK
17.1%
COGNITIVE DISABILITY
79.3/ 100
METRIC RATING
154th/ 347
METRIC RANK
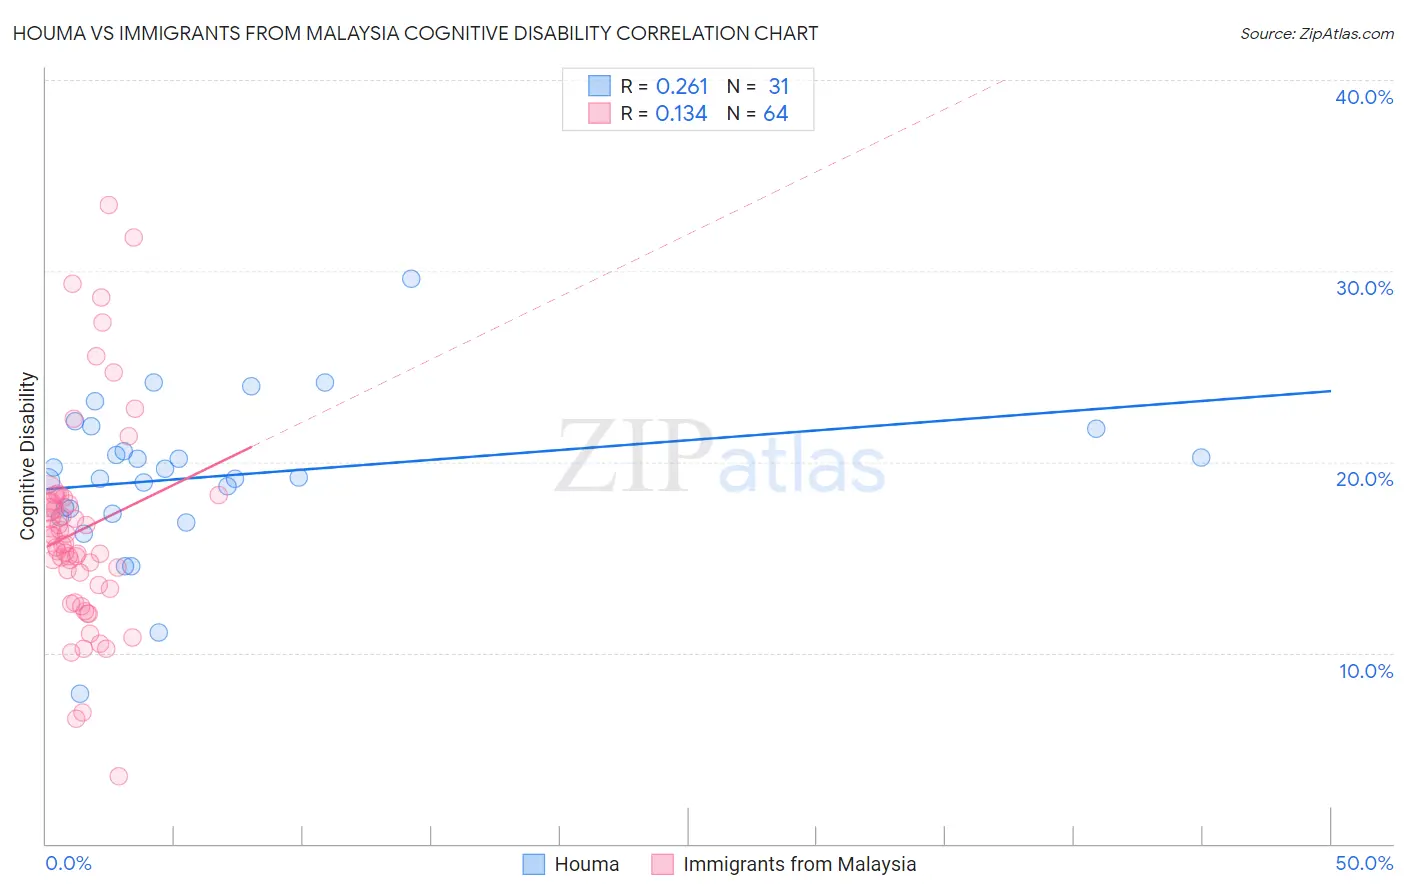
Houma vs Immigrants from Malaysia Cognitive Disability Correlation Chart
The statistical analysis conducted on geographies consisting of 36,799,095 people shows a weak positive correlation between the proportion of Houma and percentage of population with cognitive disability in the United States with a correlation coefficient (R) of 0.261 and weighted average of 19.3%. Similarly, the statistical analysis conducted on geographies consisting of 197,973,854 people shows a poor positive correlation between the proportion of Immigrants from Malaysia and percentage of population with cognitive disability in the United States with a correlation coefficient (R) of 0.134 and weighted average of 17.1%, a difference of 12.6%.
Cognitive Disability Correlation Summary
| Measurement | Houma | Immigrants from Malaysia |
| Minimum | 7.9% | 3.5% |
| Maximum | 29.6% | 33.4% |
| Range | 21.7% | 29.9% |
| Mean | 19.2% | 16.4% |
| Median | 19.2% | 15.7% |
| Interquartile 25% (IQ1) | 17.3% | 13.4% |
| Interquartile 75% (IQ3) | 21.8% | 18.0% |
| Interquartile Range (IQR) | 4.5% | 4.6% |
| Standard Deviation (Sample) | 4.0% | 5.6% |
| Standard Deviation (Population) | 4.0% | 5.5% |
Similar Demographics by Cognitive Disability
Demographics Similar to Houma by Cognitive Disability
In terms of cognitive disability, the demographic groups most similar to Houma are Tohono O'odham (19.3%, a difference of 0.0%), Cape Verdean (19.2%, a difference of 0.24%), Puerto Rican (19.2%, a difference of 0.26%), Immigrants from Zaire (19.4%, a difference of 0.69%), and Lumbee (19.1%, a difference of 0.74%).
| Demographics | Rating | Rank | Cognitive Disability |
| Immigrants | Yemen | 0.0 /100 | #333 | Tragic 18.8% |
| Sudanese | 0.0 /100 | #334 | Tragic 18.9% |
| Senegalese | 0.0 /100 | #335 | Tragic 19.0% |
| Blacks/African Americans | 0.0 /100 | #336 | Tragic 19.0% |
| Immigrants | Saudi Arabia | 0.0 /100 | #337 | Tragic 19.1% |
| Lumbee | 0.0 /100 | #338 | Tragic 19.1% |
| Puerto Ricans | 0.0 /100 | #339 | Tragic 19.2% |
| Cape Verdeans | 0.0 /100 | #340 | Tragic 19.2% |
| Tohono O'odham | 0.0 /100 | #341 | Tragic 19.3% |
| Houma | 0.0 /100 | #342 | Tragic 19.3% |
| Immigrants | Zaire | 0.0 /100 | #343 | Tragic 19.4% |
| Immigrants | Congo | 0.0 /100 | #344 | Tragic 19.7% |
| Somalis | 0.0 /100 | #345 | Tragic 19.8% |
| Immigrants | Cabo Verde | 0.0 /100 | #346 | Tragic 19.9% |
| Immigrants | Somalia | 0.0 /100 | #347 | Tragic 20.0% |
Demographics Similar to Immigrants from Malaysia by Cognitive Disability
In terms of cognitive disability, the demographic groups most similar to Immigrants from Malaysia are Brazilian (17.1%, a difference of 0.020%), Sri Lankan (17.1%, a difference of 0.020%), Immigrants from Kazakhstan (17.1%, a difference of 0.050%), Immigrants from Australia (17.1%, a difference of 0.14%), and Immigrants from Indonesia (17.1%, a difference of 0.16%).
| Demographics | Rating | Rank | Cognitive Disability |
| Scotch-Irish | 85.9 /100 | #147 | Excellent 17.1% |
| French Canadians | 85.7 /100 | #148 | Excellent 17.1% |
| Cypriots | 85.7 /100 | #149 | Excellent 17.1% |
| Basques | 85.5 /100 | #150 | Excellent 17.1% |
| Syrians | 83.0 /100 | #151 | Excellent 17.1% |
| Immigrants | Indonesia | 82.7 /100 | #152 | Excellent 17.1% |
| Immigrants | Kazakhstan | 80.5 /100 | #153 | Excellent 17.1% |
| Immigrants | Malaysia | 79.3 /100 | #154 | Good 17.1% |
| Brazilians | 78.9 /100 | #155 | Good 17.1% |
| Sri Lankans | 78.9 /100 | #156 | Good 17.1% |
| Immigrants | Australia | 76.0 /100 | #157 | Good 17.1% |
| Celtics | 74.1 /100 | #158 | Good 17.1% |
| Immigrants | Latvia | 73.2 /100 | #159 | Good 17.2% |
| Australians | 72.4 /100 | #160 | Good 17.2% |
| Americans | 72.2 /100 | #161 | Good 17.2% |