Laotian vs Immigrants from Malaysia Cognitive Disability
COMPARE
Laotian
Immigrants from Malaysia
Cognitive Disability
Cognitive Disability Comparison
Laotians
Immigrants from Malaysia
17.3%
COGNITIVE DISABILITY
50.0/ 100
METRIC RATING
174th/ 347
METRIC RANK
17.1%
COGNITIVE DISABILITY
79.3/ 100
METRIC RATING
154th/ 347
METRIC RANK
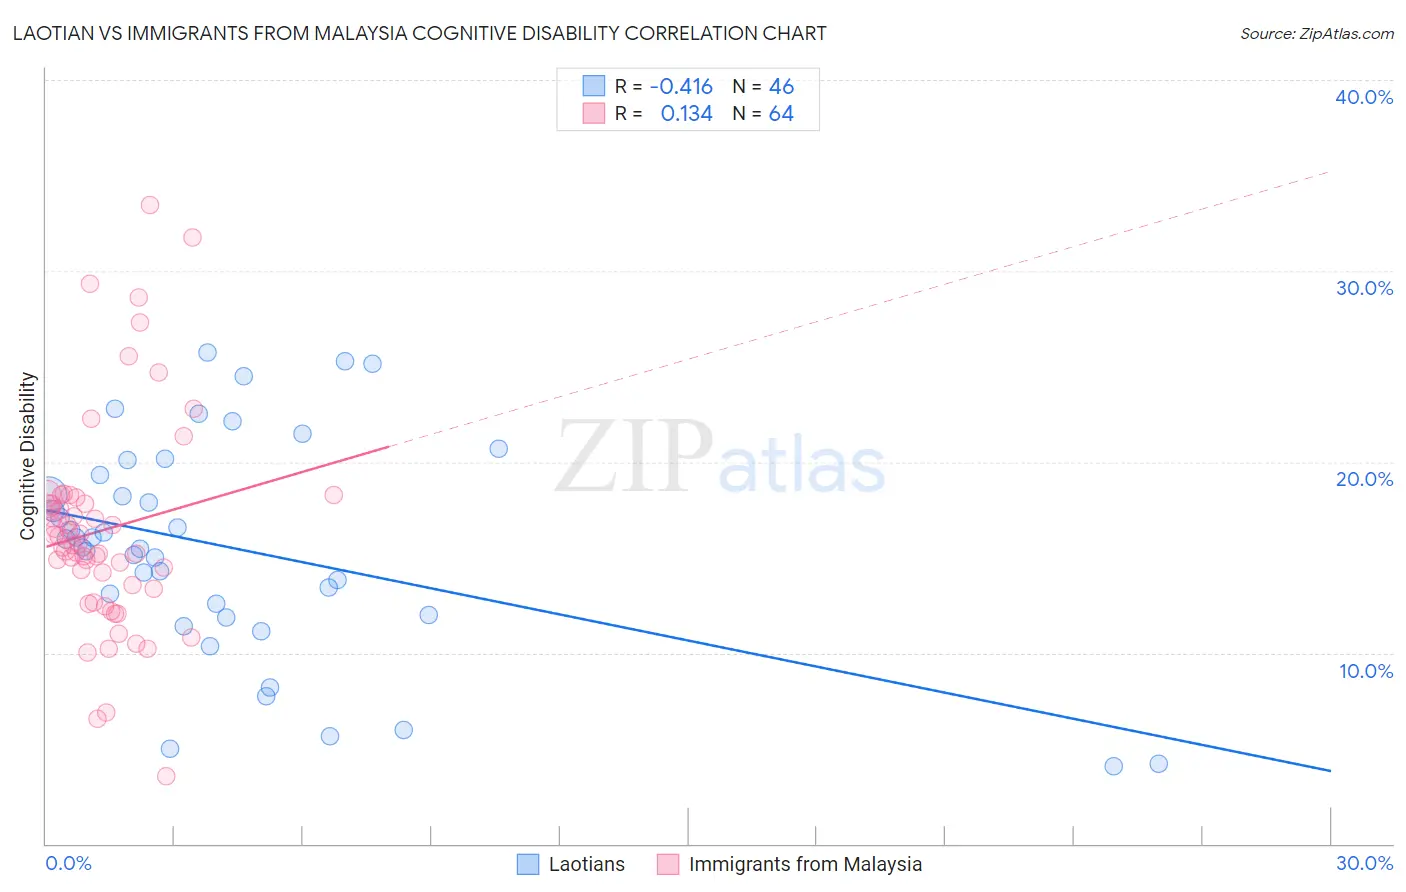
Laotian vs Immigrants from Malaysia Cognitive Disability Correlation Chart
The statistical analysis conducted on geographies consisting of 224,855,635 people shows a moderate negative correlation between the proportion of Laotians and percentage of population with cognitive disability in the United States with a correlation coefficient (R) of -0.416 and weighted average of 17.3%. Similarly, the statistical analysis conducted on geographies consisting of 197,973,854 people shows a poor positive correlation between the proportion of Immigrants from Malaysia and percentage of population with cognitive disability in the United States with a correlation coefficient (R) of 0.134 and weighted average of 17.1%, a difference of 0.97%.
Cognitive Disability Correlation Summary
| Measurement | Laotian | Immigrants from Malaysia |
| Minimum | 4.0% | 3.5% |
| Maximum | 25.7% | 33.4% |
| Range | 21.7% | 29.9% |
| Mean | 15.5% | 16.4% |
| Median | 15.7% | 15.7% |
| Interquartile 25% (IQ1) | 12.0% | 13.4% |
| Interquartile 75% (IQ3) | 19.3% | 18.0% |
| Interquartile Range (IQR) | 7.3% | 4.6% |
| Standard Deviation (Sample) | 5.7% | 5.6% |
| Standard Deviation (Population) | 5.6% | 5.5% |
Demographics Similar to Laotians and Immigrants from Malaysia by Cognitive Disability
In terms of cognitive disability, the demographic groups most similar to Laotians are Immigrants from Northern Africa (17.3%, a difference of 0.010%), Immigrants from Turkey (17.2%, a difference of 0.19%), Tlingit-Haida (17.2%, a difference of 0.27%), Ecuadorian (17.2%, a difference of 0.28%), and Immigrants from Portugal (17.2%, a difference of 0.34%). Similarly, the demographic groups most similar to Immigrants from Malaysia are Brazilian (17.1%, a difference of 0.020%), Sri Lankan (17.1%, a difference of 0.020%), Immigrants from Australia (17.1%, a difference of 0.14%), Celtic (17.1%, a difference of 0.21%), and Immigrants from Latvia (17.2%, a difference of 0.24%).
| Demographics | Rating | Rank | Cognitive Disability |
| Immigrants | Malaysia | 79.3 /100 | #154 | Good 17.1% |
| Brazilians | 78.9 /100 | #155 | Good 17.1% |
| Sri Lankans | 78.9 /100 | #156 | Good 17.1% |
| Immigrants | Australia | 76.0 /100 | #157 | Good 17.1% |
| Celtics | 74.1 /100 | #158 | Good 17.1% |
| Immigrants | Latvia | 73.2 /100 | #159 | Good 17.2% |
| Australians | 72.4 /100 | #160 | Good 17.2% |
| Americans | 72.2 /100 | #161 | Good 17.2% |
| Yugoslavians | 71.6 /100 | #162 | Good 17.2% |
| Immigrants | Switzerland | 71.5 /100 | #163 | Good 17.2% |
| Armenians | 70.1 /100 | #164 | Good 17.2% |
| Immigrants | Albania | 64.9 /100 | #165 | Good 17.2% |
| Immigrants | Ecuador | 64.4 /100 | #166 | Good 17.2% |
| Immigrants | Syria | 63.5 /100 | #167 | Good 17.2% |
| Immigrants | Immigrants | 62.5 /100 | #168 | Good 17.2% |
| Immigrants | Portugal | 61.8 /100 | #169 | Good 17.2% |
| Ecuadorians | 59.6 /100 | #170 | Average 17.2% |
| Tlingit-Haida | 59.4 /100 | #171 | Average 17.2% |
| Immigrants | Turkey | 56.7 /100 | #172 | Average 17.2% |
| Immigrants | Northern Africa | 50.2 /100 | #173 | Average 17.3% |
| Laotians | 50.0 /100 | #174 | Average 17.3% |