Cambodian vs Immigrants from Malaysia Cognitive Disability
COMPARE
Cambodian
Immigrants from Malaysia
Cognitive Disability
Cognitive Disability Comparison
Cambodians
Immigrants from Malaysia
17.3%
COGNITIVE DISABILITY
35.9/ 100
METRIC RATING
186th/ 347
METRIC RANK
17.1%
COGNITIVE DISABILITY
79.3/ 100
METRIC RATING
154th/ 347
METRIC RANK
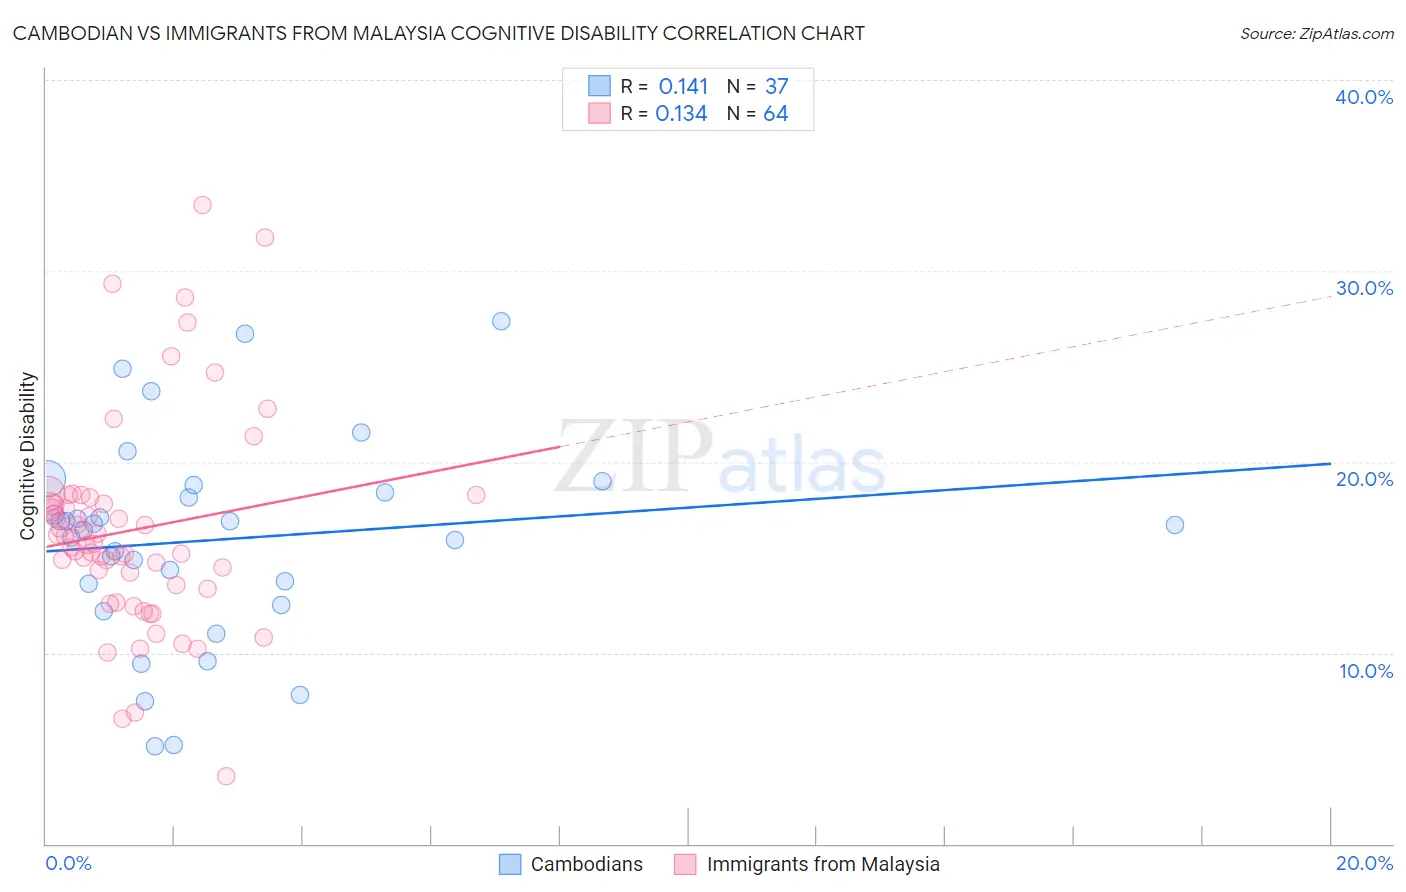
Cambodian vs Immigrants from Malaysia Cognitive Disability Correlation Chart
The statistical analysis conducted on geographies consisting of 102,506,986 people shows a poor positive correlation between the proportion of Cambodians and percentage of population with cognitive disability in the United States with a correlation coefficient (R) of 0.141 and weighted average of 17.3%. Similarly, the statistical analysis conducted on geographies consisting of 197,973,854 people shows a poor positive correlation between the proportion of Immigrants from Malaysia and percentage of population with cognitive disability in the United States with a correlation coefficient (R) of 0.134 and weighted average of 17.1%, a difference of 1.4%.
Cognitive Disability Correlation Summary
| Measurement | Cambodian | Immigrants from Malaysia |
| Minimum | 5.1% | 3.5% |
| Maximum | 27.4% | 33.4% |
| Range | 22.2% | 29.9% |
| Mean | 15.9% | 16.4% |
| Median | 16.7% | 15.7% |
| Interquartile 25% (IQ1) | 13.1% | 13.4% |
| Interquartile 75% (IQ3) | 18.6% | 18.0% |
| Interquartile Range (IQR) | 5.5% | 4.6% |
| Standard Deviation (Sample) | 5.3% | 5.6% |
| Standard Deviation (Population) | 5.2% | 5.5% |
Similar Demographics by Cognitive Disability
Demographics Similar to Cambodians by Cognitive Disability
In terms of cognitive disability, the demographic groups most similar to Cambodians are Afghan (17.3%, a difference of 0.070%), Immigrants from Fiji (17.4%, a difference of 0.070%), Crow (17.3%, a difference of 0.10%), Spaniard (17.3%, a difference of 0.13%), and Immigrants from France (17.4%, a difference of 0.20%).
| Demographics | Rating | Rank | Cognitive Disability |
| Sioux | 48.6 /100 | #179 | Average 17.3% |
| Pakistanis | 43.9 /100 | #180 | Average 17.3% |
| Immigrants | Guyana | 42.9 /100 | #181 | Average 17.3% |
| Arabs | 42.8 /100 | #182 | Average 17.3% |
| Spaniards | 40.3 /100 | #183 | Average 17.3% |
| Crow | 39.1 /100 | #184 | Fair 17.3% |
| Afghans | 38.2 /100 | #185 | Fair 17.3% |
| Cambodians | 35.9 /100 | #186 | Fair 17.3% |
| Immigrants | Fiji | 33.7 /100 | #187 | Fair 17.4% |
| Immigrants | France | 29.8 /100 | #188 | Fair 17.4% |
| Immigrants | Western Asia | 29.5 /100 | #189 | Fair 17.4% |
| Immigrants | Spain | 27.7 /100 | #190 | Fair 17.4% |
| Immigrants | Nonimmigrants | 27.4 /100 | #191 | Fair 17.4% |
| Immigrants | Haiti | 27.1 /100 | #192 | Fair 17.4% |
| Delaware | 25.6 /100 | #193 | Fair 17.4% |
Demographics Similar to Immigrants from Malaysia by Cognitive Disability
In terms of cognitive disability, the demographic groups most similar to Immigrants from Malaysia are Brazilian (17.1%, a difference of 0.020%), Sri Lankan (17.1%, a difference of 0.020%), Immigrants from Kazakhstan (17.1%, a difference of 0.050%), Immigrants from Australia (17.1%, a difference of 0.14%), and Immigrants from Indonesia (17.1%, a difference of 0.16%).
| Demographics | Rating | Rank | Cognitive Disability |
| Scotch-Irish | 85.9 /100 | #147 | Excellent 17.1% |
| French Canadians | 85.7 /100 | #148 | Excellent 17.1% |
| Cypriots | 85.7 /100 | #149 | Excellent 17.1% |
| Basques | 85.5 /100 | #150 | Excellent 17.1% |
| Syrians | 83.0 /100 | #151 | Excellent 17.1% |
| Immigrants | Indonesia | 82.7 /100 | #152 | Excellent 17.1% |
| Immigrants | Kazakhstan | 80.5 /100 | #153 | Excellent 17.1% |
| Immigrants | Malaysia | 79.3 /100 | #154 | Good 17.1% |
| Brazilians | 78.9 /100 | #155 | Good 17.1% |
| Sri Lankans | 78.9 /100 | #156 | Good 17.1% |
| Immigrants | Australia | 76.0 /100 | #157 | Good 17.1% |
| Celtics | 74.1 /100 | #158 | Good 17.1% |
| Immigrants | Latvia | 73.2 /100 | #159 | Good 17.2% |
| Australians | 72.4 /100 | #160 | Good 17.2% |
| Americans | 72.2 /100 | #161 | Good 17.2% |