Bhutanese vs Immigrants from Malaysia Cognitive Disability
COMPARE
Bhutanese
Immigrants from Malaysia
Cognitive Disability
Cognitive Disability Comparison
Bhutanese
Immigrants from Malaysia
16.6%
COGNITIVE DISABILITY
99.7/ 100
METRIC RATING
57th/ 347
METRIC RANK
17.1%
COGNITIVE DISABILITY
79.3/ 100
METRIC RATING
154th/ 347
METRIC RANK
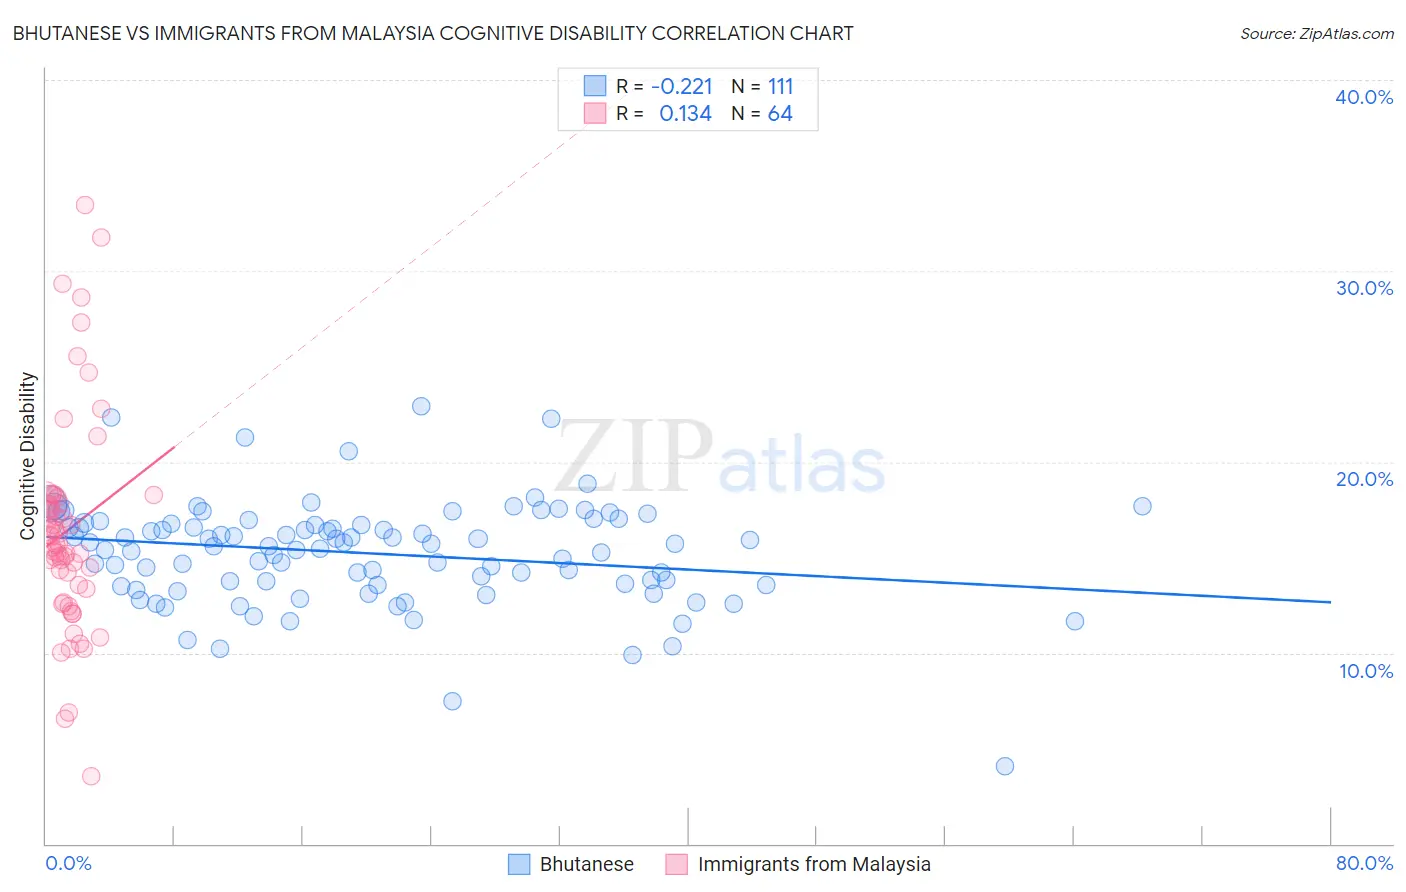
Bhutanese vs Immigrants from Malaysia Cognitive Disability Correlation Chart
The statistical analysis conducted on geographies consisting of 455,511,378 people shows a weak negative correlation between the proportion of Bhutanese and percentage of population with cognitive disability in the United States with a correlation coefficient (R) of -0.221 and weighted average of 16.6%. Similarly, the statistical analysis conducted on geographies consisting of 197,973,854 people shows a poor positive correlation between the proportion of Immigrants from Malaysia and percentage of population with cognitive disability in the United States with a correlation coefficient (R) of 0.134 and weighted average of 17.1%, a difference of 3.3%.
Cognitive Disability Correlation Summary
| Measurement | Bhutanese | Immigrants from Malaysia |
| Minimum | 4.0% | 3.5% |
| Maximum | 22.9% | 33.4% |
| Range | 18.9% | 29.9% |
| Mean | 15.2% | 16.4% |
| Median | 15.6% | 15.7% |
| Interquartile 25% (IQ1) | 13.6% | 13.4% |
| Interquartile 75% (IQ3) | 16.8% | 18.0% |
| Interquartile Range (IQR) | 3.2% | 4.6% |
| Standard Deviation (Sample) | 2.8% | 5.6% |
| Standard Deviation (Population) | 2.7% | 5.5% |
Similar Demographics by Cognitive Disability
Demographics Similar to Bhutanese by Cognitive Disability
In terms of cognitive disability, the demographic groups most similar to Bhutanese are Austrian (16.6%, a difference of 0.010%), Pennsylvania German (16.6%, a difference of 0.080%), Immigrants from Peru (16.6%, a difference of 0.080%), Romanian (16.6%, a difference of 0.090%), and Immigrants from Venezuela (16.5%, a difference of 0.10%).
| Demographics | Rating | Rank | Cognitive Disability |
| Norwegians | 99.8 /100 | #50 | Exceptional 16.5% |
| Immigrants | Korea | 99.8 /100 | #51 | Exceptional 16.5% |
| Soviet Union | 99.8 /100 | #52 | Exceptional 16.5% |
| Swedes | 99.8 /100 | #53 | Exceptional 16.5% |
| Immigrants | Iran | 99.8 /100 | #54 | Exceptional 16.5% |
| Immigrants | Venezuela | 99.7 /100 | #55 | Exceptional 16.5% |
| Austrians | 99.7 /100 | #56 | Exceptional 16.6% |
| Bhutanese | 99.7 /100 | #57 | Exceptional 16.6% |
| Pennsylvania Germans | 99.7 /100 | #58 | Exceptional 16.6% |
| Immigrants | Peru | 99.7 /100 | #59 | Exceptional 16.6% |
| Romanians | 99.7 /100 | #60 | Exceptional 16.6% |
| Immigrants | England | 99.6 /100 | #61 | Exceptional 16.6% |
| Czechoslovakians | 99.6 /100 | #62 | Exceptional 16.6% |
| Argentineans | 99.6 /100 | #63 | Exceptional 16.6% |
| Venezuelans | 99.6 /100 | #64 | Exceptional 16.6% |
Demographics Similar to Immigrants from Malaysia by Cognitive Disability
In terms of cognitive disability, the demographic groups most similar to Immigrants from Malaysia are Brazilian (17.1%, a difference of 0.020%), Sri Lankan (17.1%, a difference of 0.020%), Immigrants from Kazakhstan (17.1%, a difference of 0.050%), Immigrants from Australia (17.1%, a difference of 0.14%), and Immigrants from Indonesia (17.1%, a difference of 0.16%).
| Demographics | Rating | Rank | Cognitive Disability |
| Scotch-Irish | 85.9 /100 | #147 | Excellent 17.1% |
| French Canadians | 85.7 /100 | #148 | Excellent 17.1% |
| Cypriots | 85.7 /100 | #149 | Excellent 17.1% |
| Basques | 85.5 /100 | #150 | Excellent 17.1% |
| Syrians | 83.0 /100 | #151 | Excellent 17.1% |
| Immigrants | Indonesia | 82.7 /100 | #152 | Excellent 17.1% |
| Immigrants | Kazakhstan | 80.5 /100 | #153 | Excellent 17.1% |
| Immigrants | Malaysia | 79.3 /100 | #154 | Good 17.1% |
| Brazilians | 78.9 /100 | #155 | Good 17.1% |
| Sri Lankans | 78.9 /100 | #156 | Good 17.1% |
| Immigrants | Australia | 76.0 /100 | #157 | Good 17.1% |
| Celtics | 74.1 /100 | #158 | Good 17.1% |
| Immigrants | Latvia | 73.2 /100 | #159 | Good 17.2% |
| Australians | 72.4 /100 | #160 | Good 17.2% |
| Americans | 72.2 /100 | #161 | Good 17.2% |