Houma vs Choctaw Cognitive Disability
COMPARE
Houma
Choctaw
Cognitive Disability
Cognitive Disability Comparison
Houma
Choctaw
19.3%
COGNITIVE DISABILITY
0.0/ 100
METRIC RATING
342nd/ 347
METRIC RANK
18.4%
COGNITIVE DISABILITY
0.0/ 100
METRIC RATING
310th/ 347
METRIC RANK
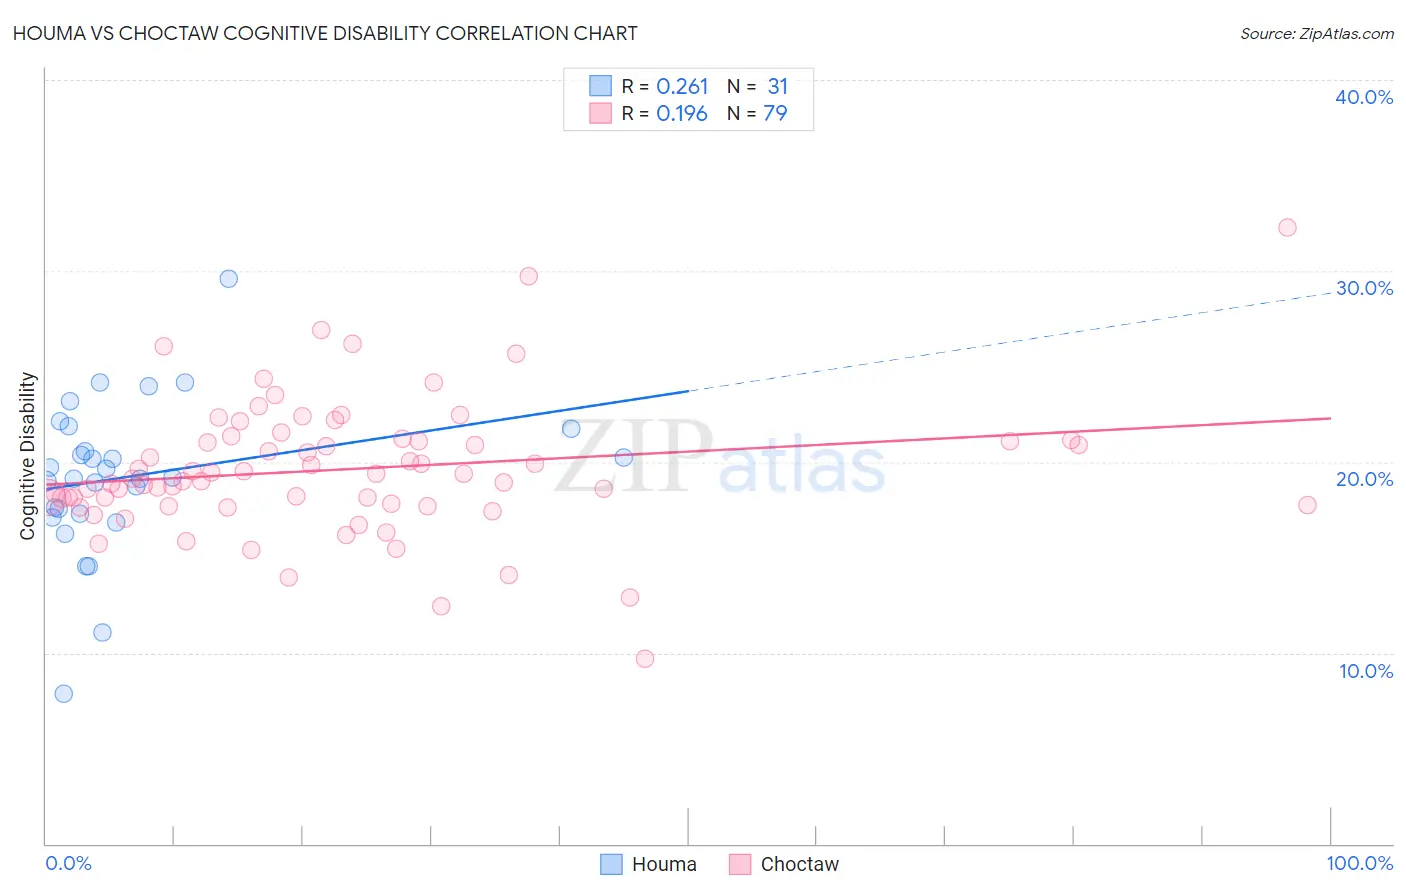
Houma vs Choctaw Cognitive Disability Correlation Chart
The statistical analysis conducted on geographies consisting of 36,799,095 people shows a weak positive correlation between the proportion of Houma and percentage of population with cognitive disability in the United States with a correlation coefficient (R) of 0.261 and weighted average of 19.3%. Similarly, the statistical analysis conducted on geographies consisting of 269,665,834 people shows a poor positive correlation between the proportion of Choctaw and percentage of population with cognitive disability in the United States with a correlation coefficient (R) of 0.196 and weighted average of 18.4%, a difference of 4.5%.
Cognitive Disability Correlation Summary
| Measurement | Houma | Choctaw |
| Minimum | 7.9% | 9.7% |
| Maximum | 29.6% | 32.3% |
| Range | 21.7% | 22.6% |
| Mean | 19.2% | 19.6% |
| Median | 19.2% | 19.1% |
| Interquartile 25% (IQ1) | 17.3% | 17.8% |
| Interquartile 75% (IQ3) | 21.8% | 21.1% |
| Interquartile Range (IQR) | 4.5% | 3.4% |
| Standard Deviation (Sample) | 4.0% | 3.6% |
| Standard Deviation (Population) | 4.0% | 3.5% |
Similar Demographics by Cognitive Disability
Demographics Similar to Houma by Cognitive Disability
In terms of cognitive disability, the demographic groups most similar to Houma are Tohono O'odham (19.3%, a difference of 0.0%), Cape Verdean (19.2%, a difference of 0.24%), Puerto Rican (19.2%, a difference of 0.26%), Immigrants from Zaire (19.4%, a difference of 0.69%), and Lumbee (19.1%, a difference of 0.74%).
| Demographics | Rating | Rank | Cognitive Disability |
| Immigrants | Yemen | 0.0 /100 | #333 | Tragic 18.8% |
| Sudanese | 0.0 /100 | #334 | Tragic 18.9% |
| Senegalese | 0.0 /100 | #335 | Tragic 19.0% |
| Blacks/African Americans | 0.0 /100 | #336 | Tragic 19.0% |
| Immigrants | Saudi Arabia | 0.0 /100 | #337 | Tragic 19.1% |
| Lumbee | 0.0 /100 | #338 | Tragic 19.1% |
| Puerto Ricans | 0.0 /100 | #339 | Tragic 19.2% |
| Cape Verdeans | 0.0 /100 | #340 | Tragic 19.2% |
| Tohono O'odham | 0.0 /100 | #341 | Tragic 19.3% |
| Houma | 0.0 /100 | #342 | Tragic 19.3% |
| Immigrants | Zaire | 0.0 /100 | #343 | Tragic 19.4% |
| Immigrants | Congo | 0.0 /100 | #344 | Tragic 19.7% |
| Somalis | 0.0 /100 | #345 | Tragic 19.8% |
| Immigrants | Cabo Verde | 0.0 /100 | #346 | Tragic 19.9% |
| Immigrants | Somalia | 0.0 /100 | #347 | Tragic 20.0% |
Demographics Similar to Choctaw by Cognitive Disability
In terms of cognitive disability, the demographic groups most similar to Choctaw are Hmong (18.4%, a difference of 0.030%), Chickasaw (18.5%, a difference of 0.31%), Immigrants from Eastern Africa (18.4%, a difference of 0.37%), Immigrants from Western Africa (18.4%, a difference of 0.41%), and Yaqui (18.5%, a difference of 0.42%).
| Demographics | Rating | Rank | Cognitive Disability |
| Immigrants | Kenya | 0.0 /100 | #303 | Tragic 18.3% |
| Immigrants | Eritrea | 0.0 /100 | #304 | Tragic 18.3% |
| Colville | 0.0 /100 | #305 | Tragic 18.3% |
| Seminole | 0.0 /100 | #306 | Tragic 18.3% |
| Ugandans | 0.0 /100 | #307 | Tragic 18.3% |
| Immigrants | Western Africa | 0.0 /100 | #308 | Tragic 18.4% |
| Immigrants | Eastern Africa | 0.0 /100 | #309 | Tragic 18.4% |
| Choctaw | 0.0 /100 | #310 | Tragic 18.4% |
| Hmong | 0.0 /100 | #311 | Tragic 18.4% |
| Chickasaw | 0.0 /100 | #312 | Tragic 18.5% |
| Yaqui | 0.0 /100 | #313 | Tragic 18.5% |
| Sub-Saharan Africans | 0.0 /100 | #314 | Tragic 18.5% |
| Immigrants | Dominica | 0.0 /100 | #315 | Tragic 18.6% |
| Immigrants | Middle Africa | 0.0 /100 | #316 | Tragic 18.6% |
| Liberians | 0.0 /100 | #317 | Tragic 18.6% |