Houma vs Immigrants from Bolivia Male Disability
COMPARE
Houma
Immigrants from Bolivia
Male Disability
Male Disability Comparison
Houma
Immigrants from Bolivia
17.4%
MALE DISABILITY
0.0/ 100
METRIC RATING
347th/ 347
METRIC RANK
9.5%
MALE DISABILITY
100.0/ 100
METRIC RATING
7th/ 347
METRIC RANK
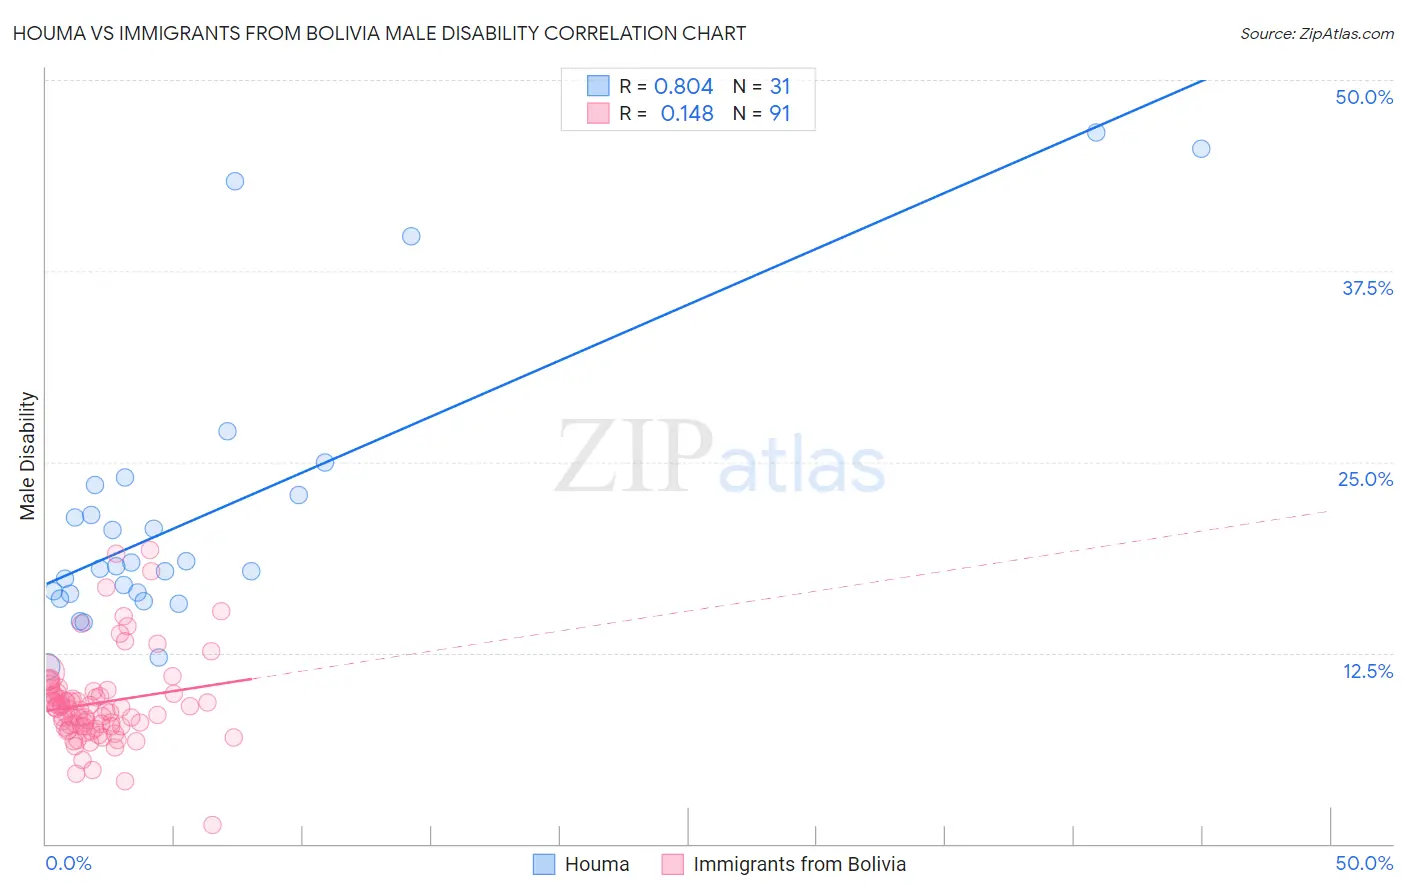
Houma vs Immigrants from Bolivia Male Disability Correlation Chart
The statistical analysis conducted on geographies consisting of 36,793,255 people shows a very strong positive correlation between the proportion of Houma and percentage of males with a disability in the United States with a correlation coefficient (R) of 0.804 and weighted average of 17.4%. Similarly, the statistical analysis conducted on geographies consisting of 158,713,247 people shows a poor positive correlation between the proportion of Immigrants from Bolivia and percentage of males with a disability in the United States with a correlation coefficient (R) of 0.148 and weighted average of 9.5%, a difference of 84.3%.
Male Disability Correlation Summary
| Measurement | Houma | Immigrants from Bolivia |
| Minimum | 11.6% | 1.2% |
| Maximum | 46.6% | 19.2% |
| Range | 35.0% | 18.0% |
| Mean | 21.8% | 9.2% |
| Median | 18.2% | 8.8% |
| Interquartile 25% (IQ1) | 16.4% | 7.7% |
| Interquartile 75% (IQ3) | 23.5% | 9.9% |
| Interquartile Range (IQR) | 7.1% | 2.2% |
| Standard Deviation (Sample) | 9.4% | 3.0% |
| Standard Deviation (Population) | 9.2% | 3.0% |
Similar Demographics by Male Disability
Demographics Similar to Houma by Male Disability
In terms of male disability, the demographic groups most similar to Houma are Colville (16.5%, a difference of 5.7%), Tsimshian (15.6%, a difference of 11.8%), Puerto Rican (15.6%, a difference of 12.1%), Creek (15.5%, a difference of 12.3%), and Kiowa (15.4%, a difference of 13.0%).
| Demographics | Rating | Rank | Male Disability |
| Yuman | 0.0 /100 | #333 | Tragic 14.7% |
| Cherokee | 0.0 /100 | #334 | Tragic 14.8% |
| Dutch West Indians | 0.0 /100 | #335 | Tragic 14.8% |
| Alaskan Athabascans | 0.0 /100 | #336 | Tragic 14.9% |
| Menominee | 0.0 /100 | #337 | Tragic 15.0% |
| Pueblo | 0.0 /100 | #338 | Tragic 15.0% |
| Chickasaw | 0.0 /100 | #339 | Tragic 15.1% |
| Lumbee | 0.0 /100 | #340 | Tragic 15.2% |
| Choctaw | 0.0 /100 | #341 | Tragic 15.4% |
| Kiowa | 0.0 /100 | #342 | Tragic 15.4% |
| Creek | 0.0 /100 | #343 | Tragic 15.5% |
| Puerto Ricans | 0.0 /100 | #344 | Tragic 15.6% |
| Tsimshian | 0.0 /100 | #345 | Tragic 15.6% |
| Colville | 0.0 /100 | #346 | Tragic 16.5% |
| Houma | 0.0 /100 | #347 | Tragic 17.4% |
Demographics Similar to Immigrants from Bolivia by Male Disability
In terms of male disability, the demographic groups most similar to Immigrants from Bolivia are Immigrants from South Central Asia (9.4%, a difference of 0.33%), Immigrants from Hong Kong (9.4%, a difference of 0.39%), Immigrants from China (9.5%, a difference of 0.60%), Immigrants from Singapore (9.5%, a difference of 0.68%), and Immigrants from Israel (9.6%, a difference of 1.1%).
| Demographics | Rating | Rank | Male Disability |
| Immigrants | India | 100.0 /100 | #1 | Exceptional 9.0% |
| Immigrants | Taiwan | 100.0 /100 | #2 | Exceptional 9.1% |
| Filipinos | 100.0 /100 | #3 | Exceptional 9.1% |
| Thais | 100.0 /100 | #4 | Exceptional 9.2% |
| Immigrants | Hong Kong | 100.0 /100 | #5 | Exceptional 9.4% |
| Immigrants | South Central Asia | 100.0 /100 | #6 | Exceptional 9.4% |
| Immigrants | Bolivia | 100.0 /100 | #7 | Exceptional 9.5% |
| Immigrants | China | 100.0 /100 | #8 | Exceptional 9.5% |
| Immigrants | Singapore | 100.0 /100 | #9 | Exceptional 9.5% |
| Immigrants | Israel | 100.0 /100 | #10 | Exceptional 9.6% |
| Immigrants | Eastern Asia | 100.0 /100 | #11 | Exceptional 9.6% |
| Bolivians | 100.0 /100 | #12 | Exceptional 9.6% |
| Iranians | 100.0 /100 | #13 | Exceptional 9.7% |
| Immigrants | Iran | 100.0 /100 | #14 | Exceptional 9.7% |
| Indians (Asian) | 100.0 /100 | #15 | Exceptional 9.7% |