Immigrants from China vs Immigrants from Moldova Disability Age Under 5
COMPARE
Immigrants from China
Immigrants from Moldova
Disability Age Under 5
Disability Age Under 5 Comparison
Immigrants from China
Immigrants from Moldova
0.96%
DISABILITY AGE UNDER 5
100.0/ 100
METRIC RATING
17th/ 347
METRIC RANK
1.1%
DISABILITY AGE UNDER 5
96.8/ 100
METRIC RATING
95th/ 347
METRIC RANK
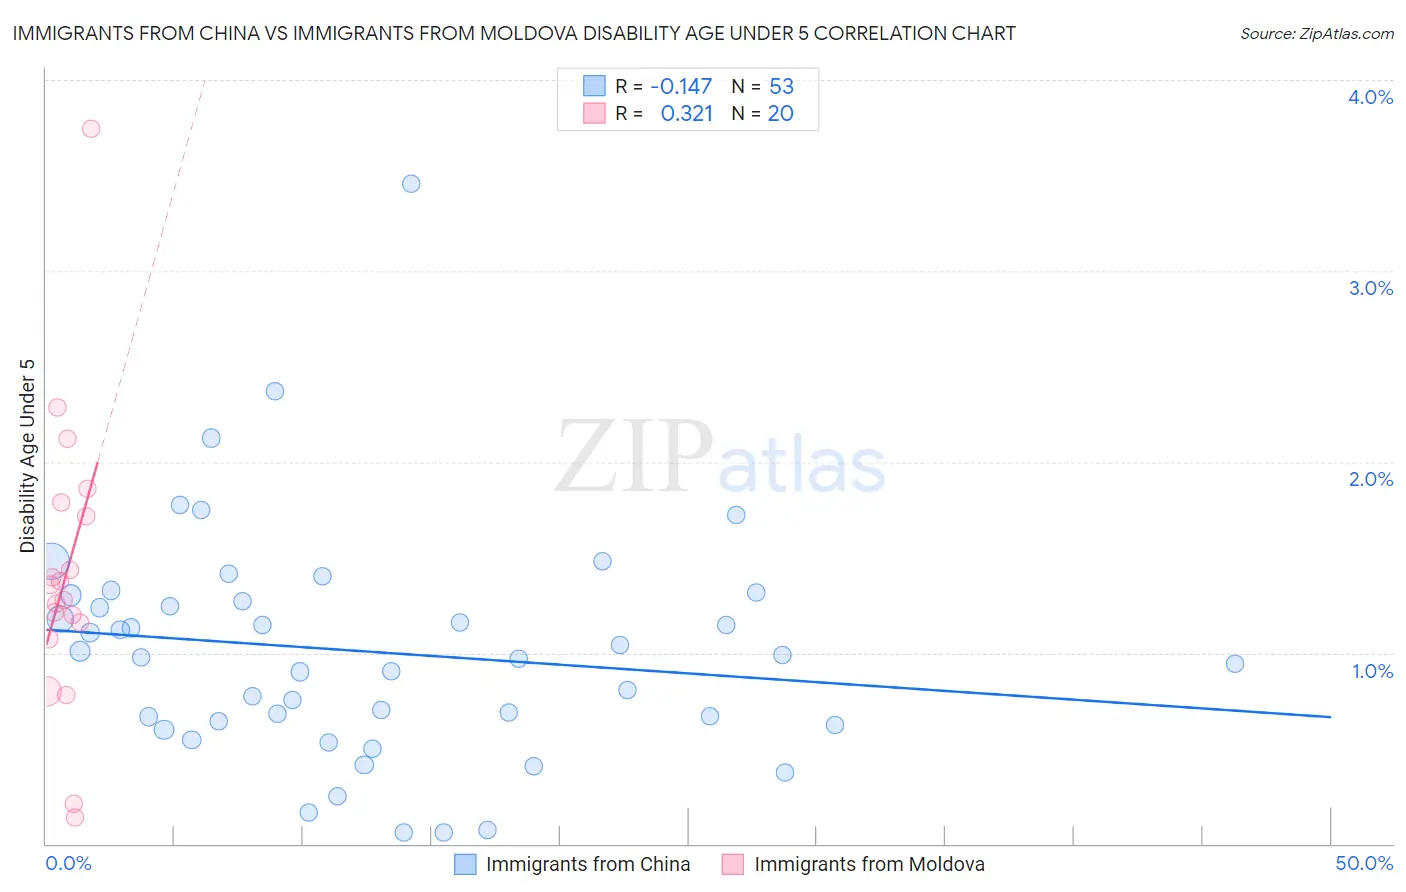
Immigrants from China vs Immigrants from Moldova Disability Age Under 5 Correlation Chart
The statistical analysis conducted on geographies consisting of 235,609,500 people shows a poor negative correlation between the proportion of Immigrants from China and percentage of population with a disability under the age of 5 in the United States with a correlation coefficient (R) of -0.147 and weighted average of 0.96%. Similarly, the statistical analysis conducted on geographies consisting of 88,816,891 people shows a mild positive correlation between the proportion of Immigrants from Moldova and percentage of population with a disability under the age of 5 in the United States with a correlation coefficient (R) of 0.321 and weighted average of 1.1%, a difference of 18.9%.
Disability Age Under 5 Correlation Summary
| Measurement | Immigrants from China | Immigrants from Moldova |
| Minimum | 0.058% | 0.14% |
| Maximum | 3.5% | 3.7% |
| Range | 3.4% | 3.6% |
| Mean | 1.0% | 1.4% |
| Median | 0.97% | 1.3% |
| Interquartile 25% (IQ1) | 0.63% | 1.1% |
| Interquartile 75% (IQ3) | 1.3% | 1.8% |
| Interquartile Range (IQR) | 0.65% | 0.63% |
| Standard Deviation (Sample) | 0.61% | 0.77% |
| Standard Deviation (Population) | 0.60% | 0.75% |
Similar Demographics by Disability Age Under 5
Demographics Similar to Immigrants from China by Disability Age Under 5
In terms of disability age under 5, the demographic groups most similar to Immigrants from China are Immigrants from Israel (0.96%, a difference of 0.41%), Immigrants from Barbados (0.97%, a difference of 0.58%), Puget Sound Salish (0.97%, a difference of 0.95%), Nepalese (0.97%, a difference of 1.1%), and Immigrants from Hong Kong (0.95%, a difference of 1.7%).
| Demographics | Rating | Rank | Disability Age Under 5 |
| Marshallese | 100.0 /100 | #10 | Exceptional 0.94% |
| Afghans | 100.0 /100 | #11 | Exceptional 0.94% |
| Immigrants | Grenada | 100.0 /100 | #12 | Exceptional 0.94% |
| Soviet Union | 100.0 /100 | #13 | Exceptional 0.95% |
| Yuman | 100.0 /100 | #14 | Exceptional 0.95% |
| Immigrants | Hong Kong | 100.0 /100 | #15 | Exceptional 0.95% |
| Immigrants | Israel | 100.0 /100 | #16 | Exceptional 0.96% |
| Immigrants | China | 100.0 /100 | #17 | Exceptional 0.96% |
| Immigrants | Barbados | 100.0 /100 | #18 | Exceptional 0.97% |
| Puget Sound Salish | 100.0 /100 | #19 | Exceptional 0.97% |
| Nepalese | 100.0 /100 | #20 | Exceptional 0.97% |
| British West Indians | 100.0 /100 | #21 | Exceptional 0.99% |
| Immigrants | Iran | 100.0 /100 | #22 | Exceptional 1.00% |
| Yakama | 100.0 /100 | #23 | Exceptional 1.00% |
| Indians (Asian) | 100.0 /100 | #24 | Exceptional 1.0% |
Demographics Similar to Immigrants from Moldova by Disability Age Under 5
In terms of disability age under 5, the demographic groups most similar to Immigrants from Moldova are Sri Lankan (1.1%, a difference of 0.050%), Mongolian (1.1%, a difference of 0.10%), Spanish American (1.1%, a difference of 0.11%), Immigrants from Cuba (1.1%, a difference of 0.14%), and Immigrants from Iraq (1.1%, a difference of 0.20%).
| Demographics | Rating | Rank | Disability Age Under 5 |
| Immigrants | Dominican Republic | 97.5 /100 | #88 | Exceptional 1.1% |
| Ethiopians | 97.2 /100 | #89 | Exceptional 1.1% |
| Chinese | 97.2 /100 | #90 | Exceptional 1.1% |
| Albanians | 97.2 /100 | #91 | Exceptional 1.1% |
| Immigrants | Cuba | 97.0 /100 | #92 | Exceptional 1.1% |
| Spanish Americans | 96.9 /100 | #93 | Exceptional 1.1% |
| Sri Lankans | 96.8 /100 | #94 | Exceptional 1.1% |
| Immigrants | Moldova | 96.8 /100 | #95 | Exceptional 1.1% |
| Mongolians | 96.6 /100 | #96 | Exceptional 1.1% |
| Immigrants | Iraq | 96.5 /100 | #97 | Exceptional 1.1% |
| Immigrants | South Eastern Asia | 96.5 /100 | #98 | Exceptional 1.1% |
| Dominicans | 96.3 /100 | #99 | Exceptional 1.1% |
| Nicaraguans | 96.3 /100 | #100 | Exceptional 1.1% |
| Immigrants | Uganda | 96.1 /100 | #101 | Exceptional 1.1% |
| Immigrants | Morocco | 96.0 /100 | #102 | Exceptional 1.2% |