Hopi vs Immigrants from Moldova 3rd Grade

COMPARE

Hopi
Race
Ancestry
AfghanAfricanAlaska NativeAlaskan AthabascanAlbanianAleutAlsatianAmericanApacheArabArapahoArgentineanArmenianAssyrian/Chaldean/SyriacAustralianAustrianBahamianBangladeshiBarbadianBasqueBelgianBelizeanBermudanBhutaneseBlackfeetBolivianBrazilianBritishBritish West IndianBulgarianBurmeseCajunCambodianCanadianCape VerdeanCarpatho RusynCelticCentral AmericanCentral American IndianCherokeeCheyenneChickasawChileanChineseChippewaChoctawColombianColvilleComancheCosta RicanCreeCreekCroatianCrowCubanCypriotCzechCzechoslovakianDanishDelawareDominicanDutchDutch West IndianEastern EuropeanEcuadorianEgyptianEnglishEstonianEthiopianEuropeanFijianFilipinoFinnishFrenchFrench American IndianFrench CanadianGermanGerman RussianGhanaianGreekGuamanian/ChamorroGuatemalanGuyaneseHaitianHmongHonduranHopiHoumaHungarianIcelanderIndian (Asian)IndonesianInupiatIranianIraqiIrishIroquoisIsraeliItalianJamaicanJapaneseJordanianKenyanKiowaKoreanLaotianLatvianLebaneseLiberianLithuanianLumbeeLuxembourgerMacedonianMalaysianMalteseMarshalleseMenomineeMexicanMexican American IndianMongolianMoroccanNative HawaiianNavajoNepaleseNew ZealanderNicaraguanNigerianNorthern EuropeanNorwegianOkinawanOsageOttawaPaiutePakistaniPalestinianPanamanianParaguayanPennsylvania GermanPeruvianPimaPolishPortuguesePotawatomiPuebloPuerto RicanPuget Sound SalishRomanianRussianSalvadoranSamoanScandinavianScotch-IrishScottishSeminoleSenegaleseSerbianShoshoneSierra LeoneanSiouxSlavicSlovakSloveneSomaliSouth AfricanSouth AmericanSouth American IndianSoviet UnionSpaniardSpanishSpanish AmericanSpanish American IndianSri LankanSubsaharan AfricanSudaneseSwedishSwissSyrianTaiwaneseThaiTlingit-HaidaTohono O'OdhamTonganTrinidadian and TobagonianTsimshianTurkishU.S. Virgin IslanderUgandanUkrainianUruguayanUteVenezuelanVietnameseWelshWest IndianYakamaYaquiYugoslavianYumanYup'ikZimbabwean
Immigration
NonimmigrantsImmigrantsAfghanistanAfricaAlbaniaArgentinaArmeniaAsiaAustraliaAustriaBahamasBangladeshBarbadosBelarusBelgiumBelizeBoliviaBosnia and HerzegovinaBrazilBulgariaBurma/MyanmarCabo VerdeCambodiaCameroonCanadaCaribbeanCentral AmericaChileChinaColombiaCongoCosta RicaCroatiaCubaCzechoslovakiaDenmarkDominicaDominican RepublicEastern AfricaEastern AsiaEastern EuropeEcuadorEgyptEl SalvadorEnglandEritreaEthiopiaEuropeFijiFranceGermanyGhanaGreeceGrenadaGuatemalaGuyanaHaitiHondurasHong KongHungaryIndiaIndonesiaIranIraqIrelandIsraelItalyJamaicaJapanJordanKazakhstanKenyaKoreaKuwaitLaosLatin AmericaLatviaLebanonLiberiaLithuaniaMalaysiaMexicoMicronesiaMiddle AfricaMoroccoNepalNetherlandsNicaraguaNigeriaNorth AmericaNorth MacedoniaNorthern AfricaNorthern EuropeNorwayOceaniaPakistanPanamaPeruPhilippinesPolandPortugalRomaniaRussiaSaudi ArabiaScotlandSenegalSerbiaSierra LeoneSingaporeSomaliaSouth AfricaSouth AmericaSouth Central AsiaSouth Eastern AsiaSouthern EuropeSpainSri LankaSt. Vincent and the GrenadinesSudanSwedenSwitzerlandSyriaTaiwanThailandTrinidad and TobagoTurkeyUgandaUkraineUruguayUzbekistanVenezuelaVietnamWest IndiesWestern AfricaWestern AsiaWestern EuropeYemenZaireZimbabweAzores
Immigrants from Moldova
Race
Ancestry
AfghanAfricanAlaska NativeAlaskan AthabascanAlbanianAleutAlsatianAmericanApacheArabArapahoArgentineanArmenianAssyrian/Chaldean/SyriacAustralianAustrianBahamianBangladeshiBarbadianBasqueBelgianBelizeanBermudanBhutaneseBlackfeetBolivianBrazilianBritishBritish West IndianBulgarianBurmeseCajunCambodianCanadianCape VerdeanCarpatho RusynCelticCentral AmericanCentral American IndianCherokeeCheyenneChickasawChileanChineseChippewaChoctawColombianColvilleComancheCosta RicanCreeCreekCroatianCrowCubanCypriotCzechCzechoslovakianDanishDelawareDominicanDutchDutch West IndianEastern EuropeanEcuadorianEgyptianEnglishEstonianEthiopianEuropeanFijianFilipinoFinnishFrenchFrench American IndianFrench CanadianGermanGerman RussianGhanaianGreekGuamanian/ChamorroGuatemalanGuyaneseHaitianHmongHonduranHoumaHungarianIcelanderIndian (Asian)IndonesianInupiatIranianIraqiIrishIroquoisIsraeliItalianJamaicanJapaneseJordanianKenyanKiowaKoreanLaotianLatvianLebaneseLiberianLithuanianLumbeeLuxembourgerMacedonianMalaysianMalteseMarshalleseMenomineeMexicanMexican American IndianMongolianMoroccanNative HawaiianNavajoNepaleseNew ZealanderNicaraguanNigerianNorthern EuropeanNorwegianOkinawanOsageOttawaPaiutePakistaniPalestinianPanamanianParaguayanPennsylvania GermanPeruvianPimaPolishPortuguesePotawatomiPuebloPuerto RicanPuget Sound SalishRomanianRussianSalvadoranSamoanScandinavianScotch-IrishScottishSeminoleSenegaleseSerbianShoshoneSierra LeoneanSiouxSlavicSlovakSloveneSomaliSouth AfricanSouth AmericanSouth American IndianSoviet UnionSpaniardSpanishSpanish AmericanSpanish American IndianSri LankanSubsaharan AfricanSudaneseSwedishSwissSyrianTaiwaneseThaiTlingit-HaidaTohono O'OdhamTonganTrinidadian and TobagonianTsimshianTurkishU.S. Virgin IslanderUgandanUkrainianUruguayanUteVenezuelanVietnameseWelshWest IndianYakamaYaquiYugoslavianYumanYup'ikZimbabwean
Immigration
NonimmigrantsImmigrantsAfghanistanAfricaAlbaniaArgentinaArmeniaAsiaAustraliaAustriaBahamasBangladeshBarbadosBelarusBelgiumBelizeBoliviaBosnia and HerzegovinaBrazilBulgariaBurma/MyanmarCabo VerdeCambodiaCameroonCanadaCaribbeanCentral AmericaChileChinaColombiaCongoCosta RicaCroatiaCubaCzechoslovakiaDenmarkDominicaDominican RepublicEastern AfricaEastern AsiaEastern EuropeEcuadorEgyptEl SalvadorEnglandEritreaEthiopiaEuropeFijiFranceGermanyGhanaGreeceGrenadaGuatemalaGuyanaHaitiHondurasHong KongHungaryIndiaIndonesiaIranIraqIrelandIsraelItalyJamaicaJapanJordanKazakhstanKenyaKoreaKuwaitLaosLatin AmericaLatviaLebanonLiberiaLithuaniaMalaysiaMexicoMicronesiaMiddle AfricaMoldovaMoroccoNepalNetherlandsNicaraguaNigeriaNorth AmericaNorth MacedoniaNorthern AfricaNorthern EuropeNorwayOceaniaPakistanPanamaPeruPhilippinesPolandPortugalRomaniaRussiaSaudi ArabiaScotlandSenegalSerbiaSierra LeoneSingaporeSomaliaSouth AfricaSouth AmericaSouth Central AsiaSouth Eastern AsiaSouthern EuropeSpainSri LankaSt. Vincent and the GrenadinesSudanSwedenSwitzerlandSyriaTaiwanThailandTrinidad and TobagoTurkeyUgandaUkraineUruguayUzbekistanVenezuelaVietnamWest IndiesWestern AfricaWestern AsiaWestern EuropeYemenZaireZimbabweAzores
3rd Grade
Income
Poverty
Unemployment
Labor Participation
Family Structure
Vehicle Availability
Education Level
Disability

3rd Grade Comparison

Hopi

Immigrants from Moldova

Exceptional
Good
98.1%
3RD GRADE
98.7/ 100
METRIC RATING
91st/ 347
METRIC RANK
97.9%
3RD GRADE
77.1/ 100
METRIC RATING
148th/ 347
METRIC RANK

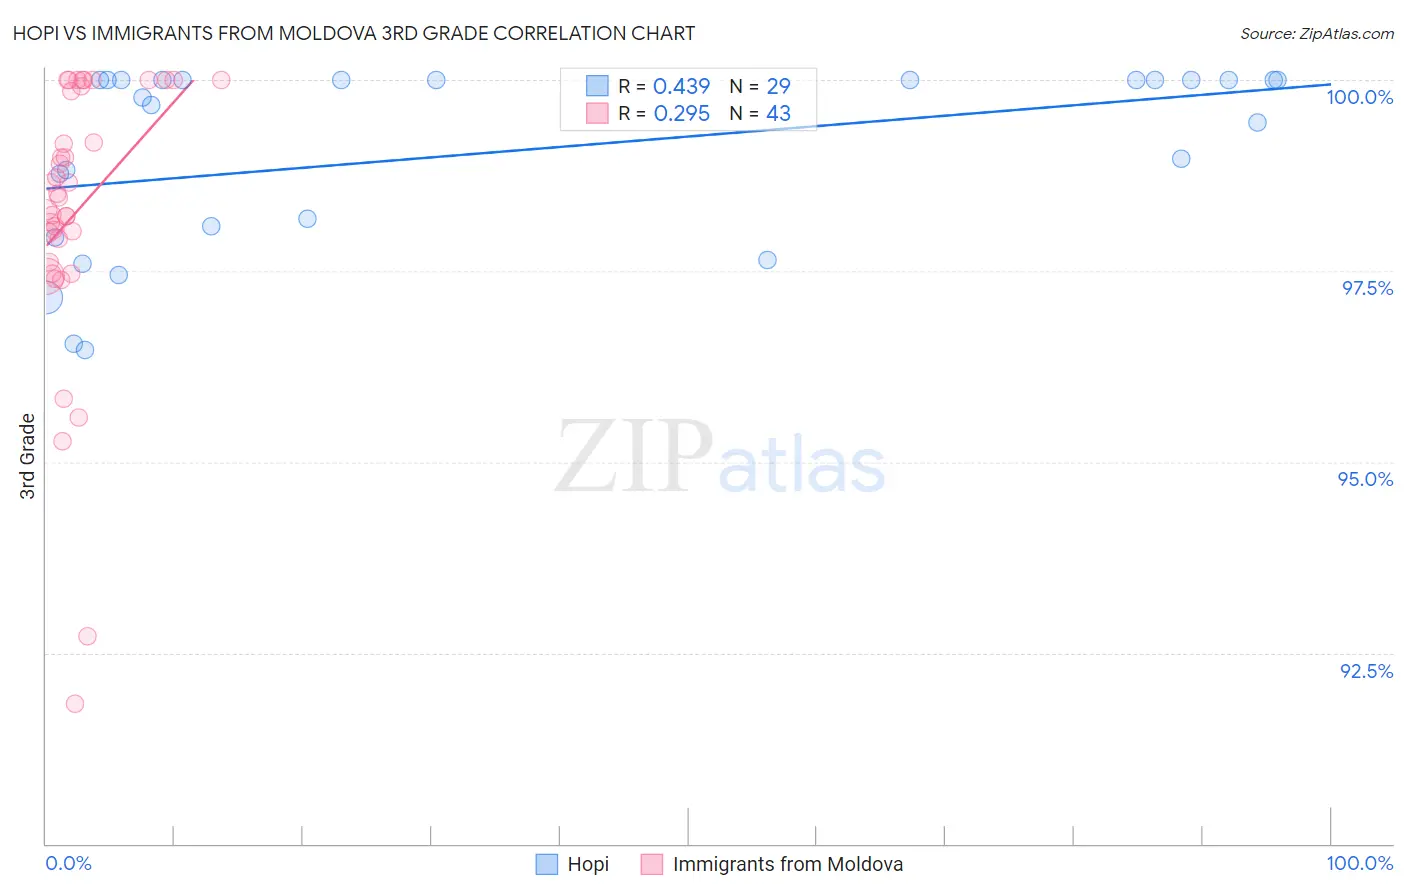
Hopi vs Immigrants from Moldova 3rd Grade Correlation Chart

The statistical analysis conducted on geographies consisting of 74,739,957 people shows a moderate positive correlation between the proportion of Hopi and percentage of population with at least 3rd grade education in the United States with a correlation coefficient (R) of 0.439 and weighted average of 98.1%. Similarly, the statistical analysis conducted on geographies consisting of 124,398,501 people shows a weak positive correlation between the proportion of Immigrants from Moldova and percentage of population with at least 3rd grade education in the United States with a correlation coefficient (R) of 0.295 and weighted average of 97.9%, a difference of 0.27%.
Hopi vs Immigrants from Moldova 3rd Grade

3rd Grade Correlation Summary

MeasurementHopiImmigrants from Moldova
Minimum96.5%91.8%
Maximum100.0%100.0%
Range3.5%8.2%
Mean99.1%98.3%
Median99.8%98.5%
Interquartile 25% (IQ1)98.0%97.6%
Interquartile 75% (IQ3)100.0%99.9%
Interquartile Range (IQR)2.0%2.3%
Standard Deviation (Sample)1.2%1.8%
Standard Deviation (Population)1.2%1.8%

Similar Demographics by 3rd Grade

Demographics Similar to Hopi by 3rd Grade

In terms of 3rd grade, the demographic groups most similar to Hopi are Zimbabwean (98.1%, a difference of 0.0%), Immigrants from South Africa (98.1%, a difference of 0.0%), Immigrants from Western Europe (98.1%, a difference of 0.0%), Immigrants from Sweden (98.1%, a difference of 0.010%), and Immigrants from Australia (98.1%, a difference of 0.010%).
DemographicsRating | Rank3rd Grade
Immigrants | Sweden
98.9
/100
|
#84
Exceptional
98.1%
Immigrants | Australia
98.9
/100
|
#85
Exceptional
98.1%
Potawatomi
98.9
/100
|
#86
Exceptional
98.1%
Immigrants | Denmark
98.8
/100
|
#87
Exceptional
98.1%
Immigrants | India
98.8
/100
|
#88
Exceptional
98.1%
Delaware
98.8
/100
|
#89
Exceptional
98.1%
Zimbabweans
98.8
/100
|
#90
Exceptional
98.1%
Hopi
98.7
/100
|
#91
Exceptional
98.1%
Immigrants | South Africa
98.7
/100
|
#92
Exceptional
98.1%
Immigrants | Western Europe
98.7
/100
|
#93
Exceptional
98.1%
Immigrants | Germany
98.4
/100
|
#94
Exceptional
98.1%
Cypriots
98.4
/100
|
#95
Exceptional
98.1%
Immigrants | Ireland
98.2
/100
|
#96
Exceptional
98.1%
South Africans
98.2
/100
|
#97
Exceptional
98.1%
Choctaw
98.0
/100
|
#98
Exceptional
98.1%

Demographics Similar to Immigrants from Moldova by 3rd Grade

In terms of 3rd grade, the demographic groups most similar to Immigrants from Moldova are Immigrants from Israel (97.9%, a difference of 0.0%), Filipino (97.9%, a difference of 0.010%), Burmese (97.9%, a difference of 0.010%), Immigrants from Greece (97.9%, a difference of 0.010%), and Alsatian (97.9%, a difference of 0.010%).
DemographicsRating | Rank3rd Grade
Immigrants | Turkey
83.5
/100
|
#141
Excellent
97.9%
Hmong
80.3
/100
|
#142
Excellent
97.9%
Filipinos
79.9
/100
|
#143
Good
97.9%
Burmese
79.6
/100
|
#144
Good
97.9%
Immigrants | Greece
79.5
/100
|
#145
Good
97.9%
Alsatians
78.3
/100
|
#146
Good
97.9%
Immigrants | Israel
77.3
/100
|
#147
Good
97.9%
Immigrants | Moldova
77.1
/100
|
#148
Good
97.9%
Immigrants | North Macedonia
74.5
/100
|
#149
Good
97.8%
Jordanians
74.5
/100
|
#150
Good
97.8%
Soviet Union
72.6
/100
|
#151
Good
97.8%
Immigrants | South Central Asia
69.5
/100
|
#152
Good
97.8%
Apache
68.5
/100
|
#153
Good
97.8%
Immigrants | Eastern Europe
64.1
/100
|
#154
Good
97.8%
Bermudans
62.6
/100
|
#155
Good
97.8%