Hmong vs Dutch Self-Care Disability
COMPARE
Hmong
Dutch
Self-Care Disability
Self-Care Disability Comparison
Hmong
Dutch
2.4%
SELF-CARE DISABILITY
89.9/ 100
METRIC RATING
126th/ 347
METRIC RANK
2.4%
SELF-CARE DISABILITY
77.5/ 100
METRIC RATING
147th/ 347
METRIC RANK
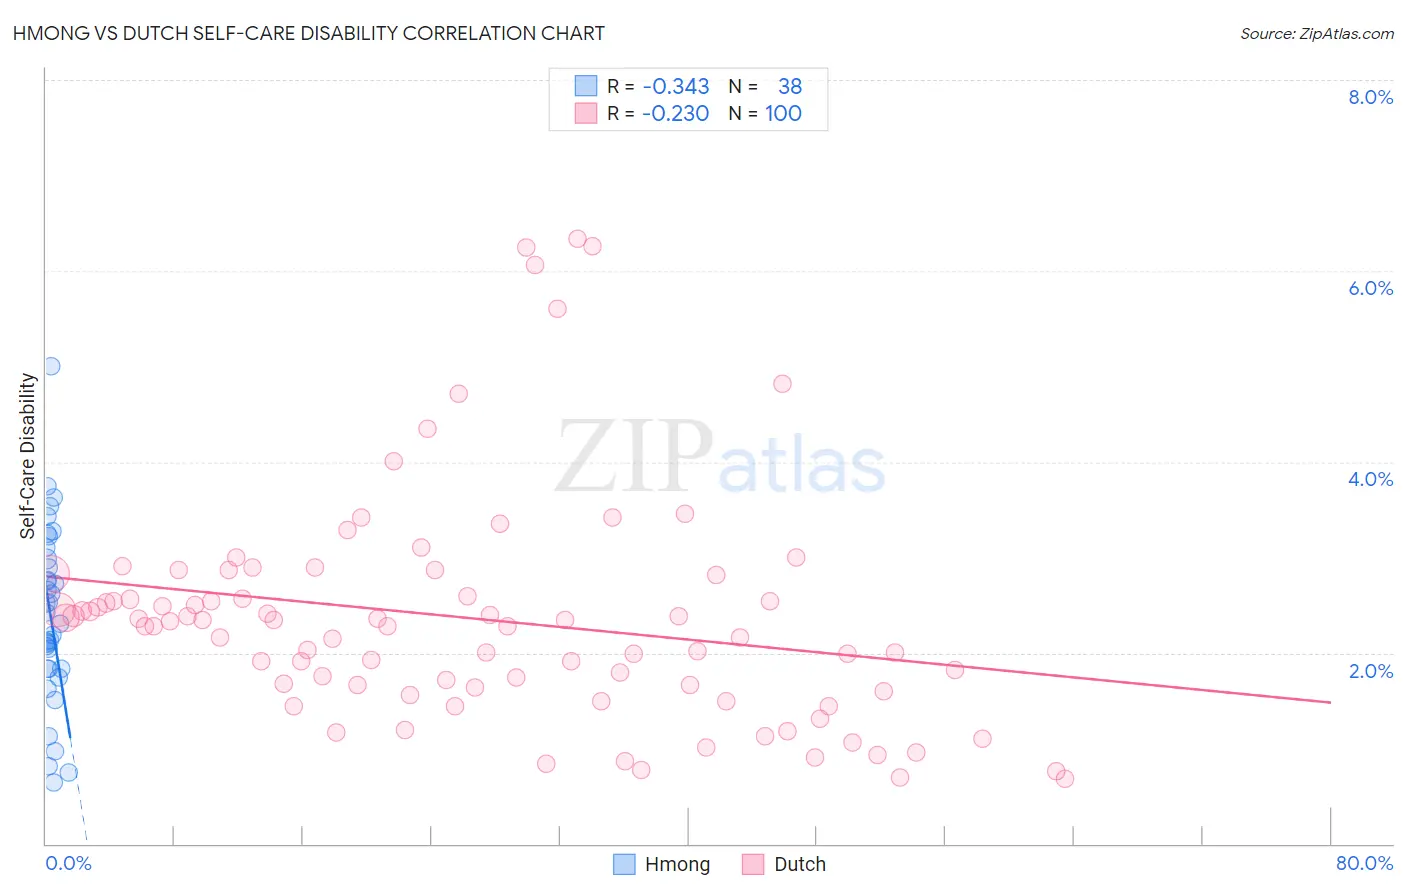
Hmong vs Dutch Self-Care Disability Correlation Chart
The statistical analysis conducted on geographies consisting of 24,680,008 people shows a mild negative correlation between the proportion of Hmong and percentage of population with self-care disability in the United States with a correlation coefficient (R) of -0.343 and weighted average of 2.4%. Similarly, the statistical analysis conducted on geographies consisting of 552,476,439 people shows a weak negative correlation between the proportion of Dutch and percentage of population with self-care disability in the United States with a correlation coefficient (R) of -0.230 and weighted average of 2.4%, a difference of 1.2%.
Self-Care Disability Correlation Summary
| Measurement | Hmong | Dutch |
| Minimum | 0.65% | 0.69% |
| Maximum | 5.0% | 6.3% |
| Range | 4.4% | 5.7% |
| Mean | 2.4% | 2.4% |
| Median | 2.4% | 2.3% |
| Interquartile 25% (IQ1) | 1.8% | 1.6% |
| Interquartile 75% (IQ3) | 3.0% | 2.7% |
| Interquartile Range (IQR) | 1.1% | 1.1% |
| Standard Deviation (Sample) | 0.92% | 1.2% |
| Standard Deviation (Population) | 0.91% | 1.2% |
Similar Demographics by Self-Care Disability
Demographics Similar to Hmong by Self-Care Disability
In terms of self-care disability, the demographic groups most similar to Hmong are Colombian (2.4%, a difference of 0.030%), Immigrants from Morocco (2.4%, a difference of 0.040%), Immigrants from North America (2.4%, a difference of 0.040%), Immigrants from Hungary (2.4%, a difference of 0.040%), and Immigrants from Nigeria (2.4%, a difference of 0.050%).
| Demographics | Rating | Rank | Self-Care Disability |
| Immigrants | Sierra Leone | 91.8 /100 | #119 | Exceptional 2.4% |
| Uruguayans | 91.5 /100 | #120 | Exceptional 2.4% |
| Peruvians | 91.3 /100 | #121 | Exceptional 2.4% |
| Belgians | 90.9 /100 | #122 | Exceptional 2.4% |
| Immigrants | Nigeria | 90.3 /100 | #123 | Exceptional 2.4% |
| Immigrants | Morocco | 90.2 /100 | #124 | Exceptional 2.4% |
| Immigrants | North America | 90.2 /100 | #124 | Exceptional 2.4% |
| Hmong | 89.9 /100 | #126 | Excellent 2.4% |
| Colombians | 89.7 /100 | #127 | Excellent 2.4% |
| Immigrants | Hungary | 89.6 /100 | #128 | Excellent 2.4% |
| Immigrants | Romania | 89.3 /100 | #129 | Excellent 2.4% |
| Immigrants | Austria | 89.0 /100 | #130 | Excellent 2.4% |
| Poles | 88.9 /100 | #131 | Excellent 2.4% |
| Immigrants | South America | 88.8 /100 | #132 | Excellent 2.4% |
| Immigrants | Colombia | 88.5 /100 | #133 | Excellent 2.4% |
Demographics Similar to Dutch by Self-Care Disability
In terms of self-care disability, the demographic groups most similar to Dutch are Romanian (2.4%, a difference of 0.11%), Arab (2.4%, a difference of 0.12%), Immigrants from Costa Rica (2.4%, a difference of 0.16%), Israeli (2.4%, a difference of 0.18%), and German (2.4%, a difference of 0.19%).
| Demographics | Rating | Rank | Self-Care Disability |
| Immigrants | Uruguay | 85.4 /100 | #140 | Excellent 2.4% |
| Alaska Natives | 84.5 /100 | #141 | Excellent 2.4% |
| Immigrants | Peru | 83.2 /100 | #142 | Excellent 2.4% |
| Afghans | 82.3 /100 | #143 | Excellent 2.4% |
| Costa Ricans | 80.8 /100 | #144 | Excellent 2.4% |
| Germans | 80.1 /100 | #145 | Excellent 2.4% |
| Israelis | 80.0 /100 | #146 | Good 2.4% |
| Dutch | 77.5 /100 | #147 | Good 2.4% |
| Romanians | 75.8 /100 | #148 | Good 2.4% |
| Arabs | 75.7 /100 | #149 | Good 2.4% |
| Immigrants | Costa Rica | 75.1 /100 | #150 | Good 2.4% |
| Basques | 74.0 /100 | #151 | Good 2.4% |
| Tlingit-Haida | 73.5 /100 | #152 | Good 2.4% |
| Immigrants | England | 73.5 /100 | #153 | Good 2.4% |
| Italians | 72.2 /100 | #154 | Good 2.4% |