Hmong vs Immigrants from Nigeria Self-Care Disability
COMPARE
Hmong
Immigrants from Nigeria
Self-Care Disability
Self-Care Disability Comparison
Hmong
Immigrants from Nigeria
2.4%
SELF-CARE DISABILITY
89.9/ 100
METRIC RATING
126th/ 347
METRIC RANK
2.4%
SELF-CARE DISABILITY
90.3/ 100
METRIC RATING
123rd/ 347
METRIC RANK
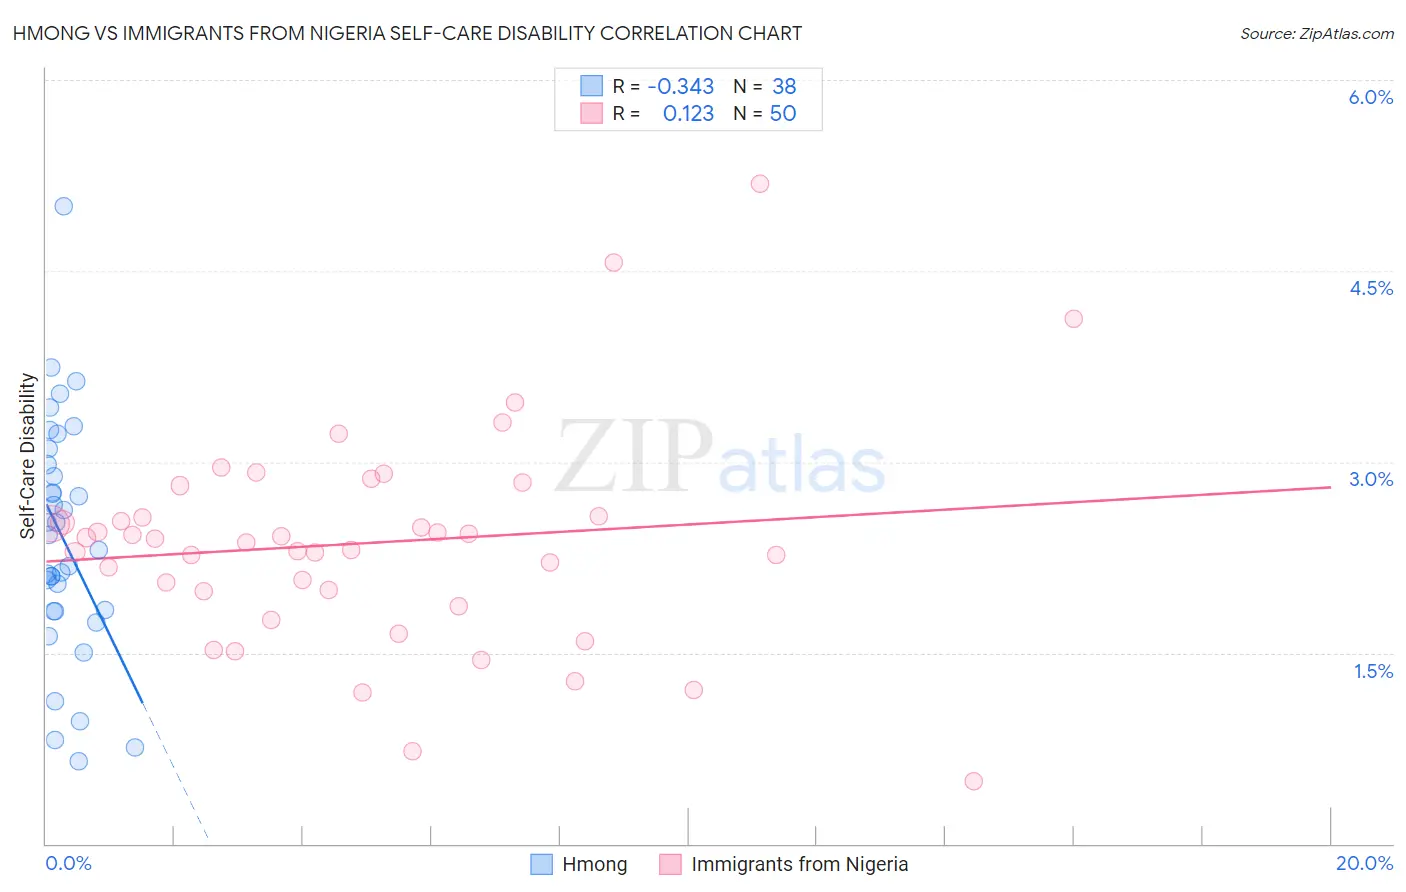
Hmong vs Immigrants from Nigeria Self-Care Disability Correlation Chart
The statistical analysis conducted on geographies consisting of 24,680,008 people shows a mild negative correlation between the proportion of Hmong and percentage of population with self-care disability in the United States with a correlation coefficient (R) of -0.343 and weighted average of 2.4%. Similarly, the statistical analysis conducted on geographies consisting of 283,219,403 people shows a poor positive correlation between the proportion of Immigrants from Nigeria and percentage of population with self-care disability in the United States with a correlation coefficient (R) of 0.123 and weighted average of 2.4%, a difference of 0.050%.
Self-Care Disability Correlation Summary
| Measurement | Hmong | Immigrants from Nigeria |
| Minimum | 0.65% | 0.50% |
| Maximum | 5.0% | 5.2% |
| Range | 4.4% | 4.7% |
| Mean | 2.4% | 2.4% |
| Median | 2.4% | 2.4% |
| Interquartile 25% (IQ1) | 1.8% | 2.0% |
| Interquartile 75% (IQ3) | 3.0% | 2.6% |
| Interquartile Range (IQR) | 1.1% | 0.59% |
| Standard Deviation (Sample) | 0.92% | 0.85% |
| Standard Deviation (Population) | 0.91% | 0.84% |
Demographics Similar to Hmong and Immigrants from Nigeria by Self-Care Disability
In terms of self-care disability, the demographic groups most similar to Hmong are Colombian (2.4%, a difference of 0.030%), Immigrants from North America (2.4%, a difference of 0.040%), Immigrants from Morocco (2.4%, a difference of 0.040%), Immigrants from Hungary (2.4%, a difference of 0.040%), and Immigrants from Romania (2.4%, a difference of 0.090%). Similarly, the demographic groups most similar to Immigrants from Nigeria are Immigrants from North America (2.4%, a difference of 0.010%), Immigrants from Morocco (2.4%, a difference of 0.010%), Belgian (2.4%, a difference of 0.080%), Colombian (2.4%, a difference of 0.080%), and Immigrants from Hungary (2.4%, a difference of 0.090%).
| Demographics | Rating | Rank | Self-Care Disability |
| Immigrants | North Macedonia | 93.1 /100 | #114 | Exceptional 2.4% |
| Immigrants | Hong Kong | 93.1 /100 | #115 | Exceptional 2.4% |
| Northern Europeans | 92.9 /100 | #116 | Exceptional 2.4% |
| Taiwanese | 92.5 /100 | #117 | Exceptional 2.4% |
| Immigrants | Canada | 92.0 /100 | #118 | Exceptional 2.4% |
| Immigrants | Sierra Leone | 91.8 /100 | #119 | Exceptional 2.4% |
| Uruguayans | 91.5 /100 | #120 | Exceptional 2.4% |
| Peruvians | 91.3 /100 | #121 | Exceptional 2.4% |
| Belgians | 90.9 /100 | #122 | Exceptional 2.4% |
| Immigrants | Nigeria | 90.3 /100 | #123 | Exceptional 2.4% |
| Immigrants | North America | 90.2 /100 | #124 | Exceptional 2.4% |
| Immigrants | Morocco | 90.2 /100 | #124 | Exceptional 2.4% |
| Hmong | 89.9 /100 | #126 | Excellent 2.4% |
| Colombians | 89.7 /100 | #127 | Excellent 2.4% |
| Immigrants | Hungary | 89.6 /100 | #128 | Excellent 2.4% |
| Immigrants | Romania | 89.3 /100 | #129 | Excellent 2.4% |
| Immigrants | Austria | 89.0 /100 | #130 | Excellent 2.4% |
| Poles | 88.9 /100 | #131 | Excellent 2.4% |
| Immigrants | South America | 88.8 /100 | #132 | Excellent 2.4% |
| Immigrants | Colombia | 88.5 /100 | #133 | Excellent 2.4% |
| Russians | 88.2 /100 | #134 | Excellent 2.4% |